Stack
Stacks values on one another, for stacked bars and areas, 100% stacks and streamgraphs.
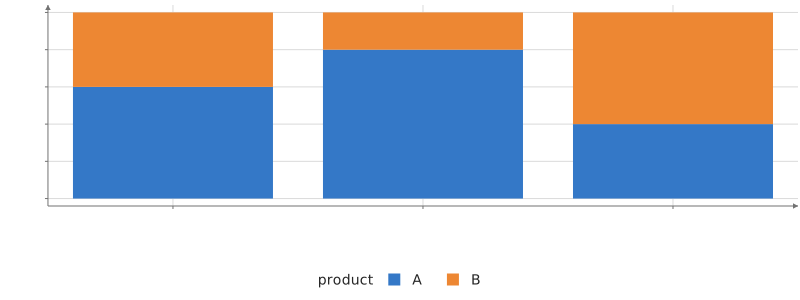
Static preview; loading the interactive plot
import hmplot as hm

data = {
    "region": ["North", "North", "South", "South", "East", "East"],
    "product": ["A", "B", "A", "B", "A", "B"],
    "sales": [3, 2, 4, 1, 2, 3],
}
with hm.Plot(data=data, height=300, axes2d=True) as plot:
    with hm.Stack(x="region", y="sales", series="product"):
        hm.charts.Bar(x="region", y="y1", baseline="y0", fill="product")
plot
Usage
Outputs lower and upper interval columns, y0 and y1, with names configurable through as. Rows with the same x stack together, ordered by series, then by row; aggregation remains explicit.
offset places each stack. “zero” (the default) stacks positive values up from 0 and negative ones down. “expand” scales each stack’s total magnitude to 1, for 100% stacks: draw a Bar with y=“y1” and baseline=“y0” over it. “center” centers each stack on 0, and “wiggle” is d3’s streamgraph offset: each stack moves so the layers change slope as little as they can. center and wiggle need non-negative values (a negative one is an error naming the column), and wiggle needs series.
order sets the series’ order in each stack: a list of categories, or “none” (the series’ own order), “appearance” (by the x of each series’ peak), “asc” or “desc” (by each series’ total), “insideOut” (the largest series in the middle, the streamgraph order) or “reverse”. Hidden rows add nothing to the totals, peaks or offsets.
To let the viewer change a setting, read an input in it: offset={input("offset")} (Python offset=hm.input.offset), where offset is a Select of offsets.