Row
Puts its children side by side.
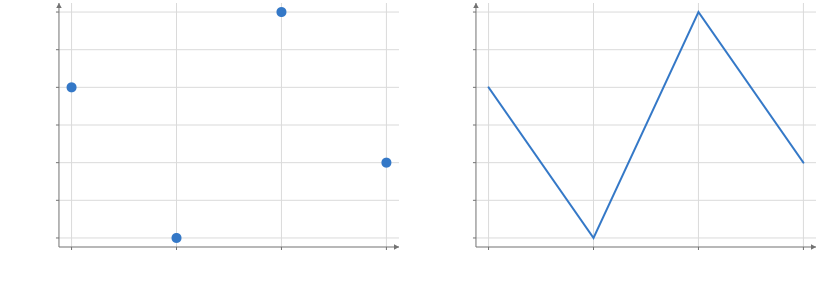
Static preview; loading the interactive plot
import hmplot as hm

data = {"x": [1, 2, 3, 4], "y": [3, 1, 4, 2]}
with hm.Row() as row:
    with hm.Plot(data=data, height=300, axes2d=True):
        hm.Points(x="x", y="y")
    with hm.Plot(data=data, height=300, axes2d=True):
        hm.Line(x="x", y="y")
row
Usage
gap is in pixels. wrap and min_width make a notebook dashboard responsive. widths=[3, 2] gives the first child three fifths of the row and the second two fifths at every width; with wrap=True the row stacks once its narrowest share would be narrower than min_width (Row(widths=[3, 2], wrap=True, min_width=286, gap=12) is three fifths and two fifths, 12 px apart, and one column below about 730 px). In Svelte use a flex or grid container rather than importing Row from hmplot: flex: 3 1 429px and flex: 2 1 286px on the two children of a wrapping flex row lay them out the same.
For inputs beside plots, use hm.Row(wrap=True, min_width=0): inputs keep their natural widths and wrap as space runs out. This replaces Controls. The row shares its surrounding input context.