Calculate
New columns computed from expressions over the table's columns.
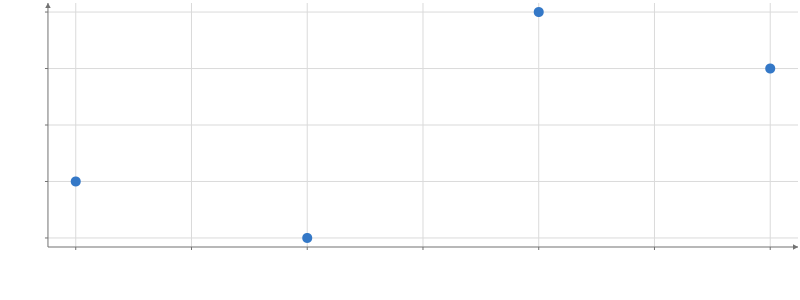
Static preview; loading the interactive plot
import hmplot as hm

data = {"x": [1, 2, 3, 4], "y": [3, 1, 4, 2]}
with hm.Plot(data=data, height=300, axes2d=True) as plot:
    with hm.Calculate(total=hm.col.x + hm.col.y):
        hm.Points(x="x", y="total")
plot
Usage
Assignments within one Calculate are simultaneous, so an expression cannot read a column defined in the same scope. Nest Calculate scopes when one derived column depends on another. Expressions run on the GPU and may read any column in scope, including the @selected, @brushed, and @hovered virtual columns.
Reductions
mean, sum, count, min, max, std, variance (Python var), median, quantile(x, p), mode, first, and last collapse a column to one value, which broadcasts over every row: divide(subtract(col("x"), mean("x")), std("x")) is a standard score. Missing and nonfinite values are skipped, an empty input is NaN (count and sum are 0), and the population forms (ddof = 0) match numpy’s defaults.
Pass by to reduce within each group instead, giving every row its own group’s value (pandas transform semantics): mean("x", {by: "species"}), Python hm.mean("x", by="species"). The grouping columns must be categorical, because an expression is evaluated without reading anything back from the GPU; use Group for numeric keys. mode, first, and last of a category column stay categorical.
Reductions also work in a Filter condition — greater(col("x"), mean("x")) keeps the rows above the mean — and as transform parameters; see Bin and Density.
Reductions also accept a where predicate; any/all use logical boolean values. Row-aligned cumsum, lag, lead and window expressions calculate within groups, optionally ordered by orderBy (order_by in Python), then restore original row alignment. See Reductions for typed fills, missing-value policies and examples.