Scene
The root of a Python display: it holds plots, layouts and inputs and stacks its children top to bottom.
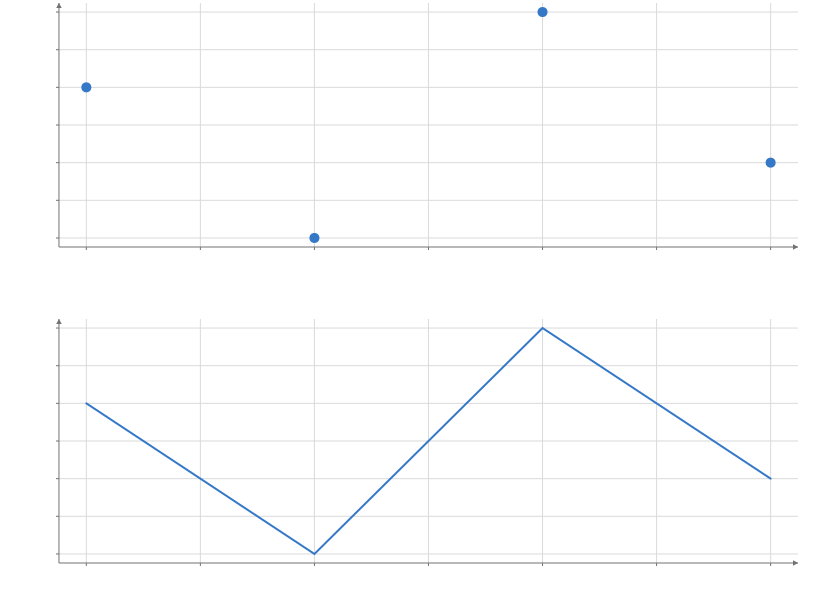
Static preview; loading the interactive plot
import hmplot as hm

data = {"x": [1, 2, 3, 4], "y": [3, 1, 4, 2]}
with hm.Scene() as scene:
    with hm.Plot(data=data, height=300, axes2d=True):
        hm.Points(x="x", y="y")
    with hm.Plot(data=data, height=300, axes2d=True):
        hm.Line(x="x", y="y")
scene
Usage
Optional for a single Plot or Facet. Use Scene with Row, Column, or Grid(columns=…) for dashboards. Its batch_update coordinates changes and its export methods compose the display. Svelte applications use normal markup/CSS for this layout.