Simulate
Per-row state, such as positions and velocities, stepped at a fixed interval for the marks inside it to draw.
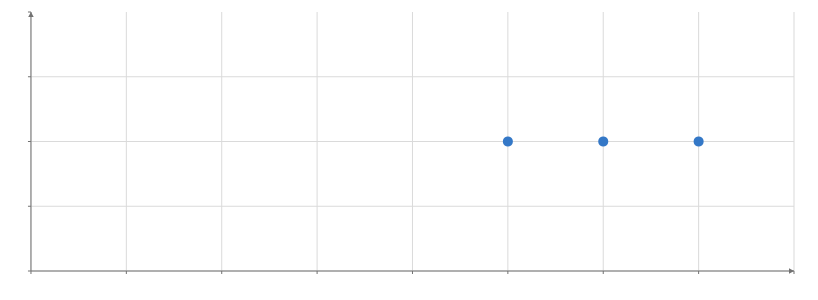
Static preview; loading the interactive plot
import hmplot as hm

radius, speed = hm.row() + 1, 3 - hm.row()
# Each step, a row's angle moves on by its speed (radians per second) times the step.
angle = hm.prev.angle + speed * hm.view.dt / 1000
with hm.Data(rows=3) as table:
    hm.Checkbox(name="running", label="Run simulation", value=False)
    with hm.Simulate(initial={"angle": 0}, update={"angle": angle}, running=hm.input.running):
        with hm.Plot(height=300, axes2d=True, x={"domain": [-4, 4]}, y={"domain": [-4, 4]}):
            hm.Points(x=radius * hm.cos(hm.col.angle), y=radius * hm.sin(hm.col.angle))
table
Usage
Simulate keeps state columns for the rows of the Data scope around it and steps them at a fixed interval of simulated time. initial gives each state column’s first value and update its next one; an update reads the state after the previous step with prev("x") (Python hm.prev.x), the parent’s columns with col("x"), the step in milliseconds as "@dt" (hm.view.dt), inputs with input("name"), and the Simulate’s own rows’ "@selected", "@brushed" and "@hovered". Every update reads the previous step, so the order of the columns does not matter.
Steps are counted from elapsed time (at most maxSteps in one frame), so the motion is the same at 60 and 120 Hz. With stop, the simulation settles when nothing moves more than tolerance over every steps; a change of its data, inputs, selection or reset wakes it. running={input("run")} with a Checkbox pauses it, and reset={input("kick")} with a Button starts again from initial. Under prefers-reduced-motion a Simulate that runs from the start stays at its first state (its exports show that state) until running changes; setAnimationTime still steps it. A new parent keeps each surviving row’s state by key.