Voronoi
Each point's Voronoi cell, as triangles for Polygon.
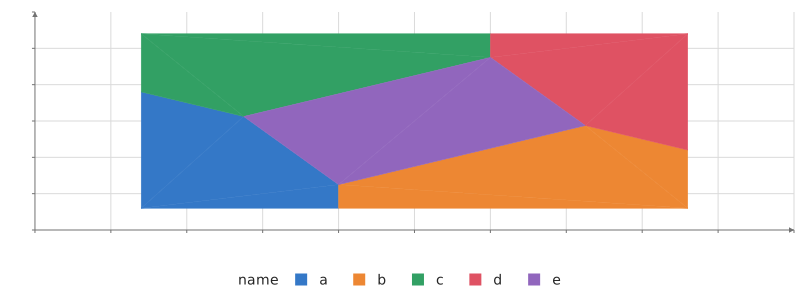
Static preview; loading the interactive plot
import hmplot as hm

data = {"name": ["a", "b", "c", "d", "e"], "x": [1, 3, 2, 4, 2.5], "y": [1, 1, 3, 3, 2]}
with hm.Plot(data=data, height=300, axes2d=True) as plot:
    with hm.Voronoi(x="x", y="y"):
        hm.Polygon(fill="name")
plot
Usage
Voronoi makes each point’s cell, clipped to extent (default: the points’ bounds and a tenth around them), as triangles for Polygon. Each cell’s triangles carry its point’s row, so hovering a cell highlights its point.