Join
Columns from a second table added to each row, matched by a key.
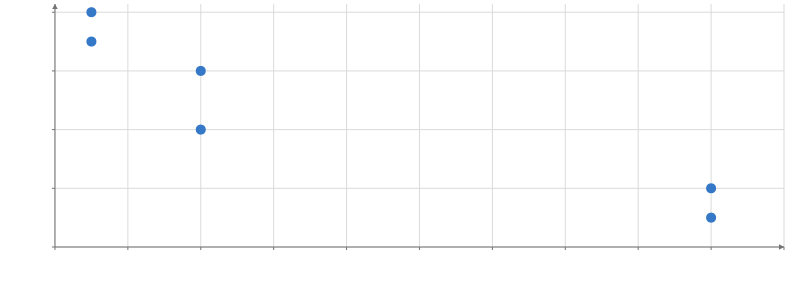
Static preview; loading the interactive plot
import hmplot as hm

data = {"station": ["A", "B", "C", "A", "B", "C"], "temperature": [12, 15, 9, 14, 16, 10]}
stations = {"station": ["A", "B", "C"], "altitude": [200, 50, 900]}
with hm.Plot(data=data, height=300, axes2d=True) as plot:
    with hm.Join(data=stations, on="station"):
        hm.Points(x="altitude", y="temperature")
plot
Usage
Join adds columns from a second table to every row of the Data scope it sits in, matching rows by a key: each flight gets its origin airport’s region from a table of airports. The joined columns are ordinary columns below it, so marks color, place, filter and brush by them.
how="left" (the default) keeps every row, with missing values where a key has no match; how="inner" hides those rows. A key repeated in the joined table is an error, and so is a joined column named like one the table has (choose fields, or rename with as).
data= can also be another transform, joined live: its output, recomputed as its inputs change,
reaches this Join without a round trip to Python, also in an exported page. Route geometry gets
the counts and mean delays of a Group of the brushed flights:
with hm.Data(flights):
    with hm.Filter(where="@brushed"):
        stats = hm.Group(by="route", columns={"flights": hm.count(), "delay": hm.mean("delay")})
with hm.Plot(data=routes):
    with hm.Join(data=stats, on="route", fields=["flights", "delay"]):
hm.Points(x="x", y="y", size="flights", fill="delay")<script>
let stats = $state(); // the Group's handle: bind:this
</script>
<Data value={flights}>
<Plot interactive="brush"><Points x="dep_hour" y="delay" brush={{ axis: "x" }} /></Plot>
<Filter where="@brushed" inactive="all">
<Group bind:this={stats} by="route" columns={{ flights: count(), delay: mean("delay") }} />
</Filter>
</Data>
{#if stats}
<Plot data={routes}>
<Join data={stats} on="route" fields={["flights", "delay"]}>
<Points x="x" y="y" size="flights" fill="delay" />
</Join>
</Plot>
{/if}The rows are this Join’s own, in their order: a live table only gives them columns. New keys in
the output (a route no flight is brushed on) replan the matching; new values with the same keys
only regather the columns. A route with no matching row has missing values (how="inner" hides it). The output must have each key once, as a Group’s does; a repeated key is an error,
never an expansion of rows. The reference is fixed, and a Join never reads its own output. The
joined columns carry their values, not the right table’s interaction state: a brush on the routes
is the routes’ own. Mark data= and hm.Data(value=...) take the same references (see Data).
The joined table may also be a value: load it first (a fetch, pandas). The row mapping is built once per key column and table version, on the host, so keys match exactly: text, integers past 2^24, times and composite keys.