stats.Window
A moving average (or other reduction) over each row and its neighbors.
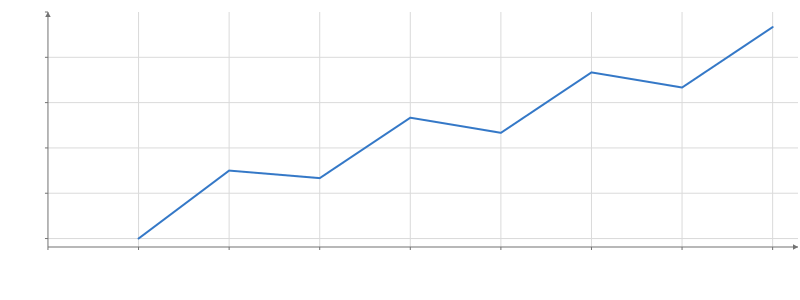
Static preview; loading the interactive plot
import hmplot as hm

data = {"x": [1, 2, 3, 4, 5, 6, 7, 8], "y": [2, 5, 3, 6, 4, 7, 5, 8]}
with hm.Plot(data=data, height=300, axes2d=True) as plot:
    with hm.stats.Window(field="y", size=3):
        hm.Line(x="x", y="smoothed")
plot
Usage
Adds a derived column without sorting observations. Defaults to a trailing mean over five observations. align supports trailing, center, or leading; by separates groups. Sort explicitly before Window when time order is required.
To let the viewer change a setting, read an input in it: size={input("size")} (Python size=hm.input.size), where size is a Slider.
any and all reduce logical booleans or finite numeric truth values; empty/all-missing windows
yield false and true respectively. The window(value, {size, reduce, align, by, orderBy}) expression uses the same kernels and restores results to original rows after local ordering.
Python uses hm.window(value, size=..., order_by=...). See Reductions.
This template expands to Calculate with columns={smoothed: window(field, {size, reduce, align, by})} (using the name passed as as).
It reuses the window expression’s kernels and the ordinary transform lifecycle, including input
controls, status subscriptions, updates, and error recovery.