stats.Summary
An estimate per group, the mean or median, with an interval around it: the numbers behind error bars.
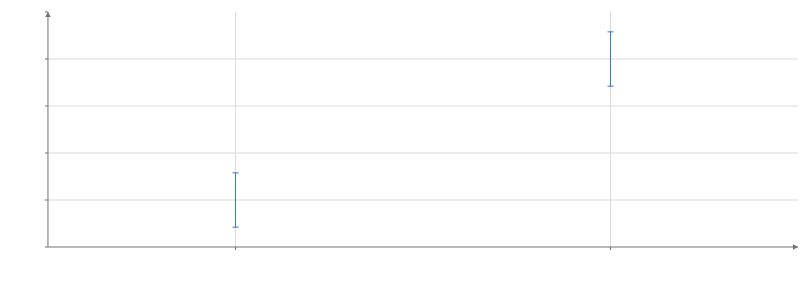
Static preview; loading the interactive plot
import hmplot as hm

data = {"group": ["a", "a", "a", "b", "b", "b"], "value": [1, 2, 3, 4, 6, 5]}
with hm.Plot(data=data, height=300, axes2d=True) as plot:
    with hm.stats.Summary(field="value", by="group", interval="standard-error"):
        hm.charts.ErrorBars(x="group", y="estimate", lower="lower", upper="upper")
plot
Usage
Outputs estimate, lower, upper, count, standardDeviation, and standardError. Default estimate is mean and interval is none. Analytic intervals require mean; bootstrap supports mean or median with 1,000 replicates and seed 42 by default. A singleton has no defined sample variability.
To let the viewer change a setting, read an input in it: interval={input("interval")} (Python interval=hm.input.interval), where interval is a Select of interval names.