Markdown
Formatted text (emphasis, lists, tables, math) beside plots in a Python layout.
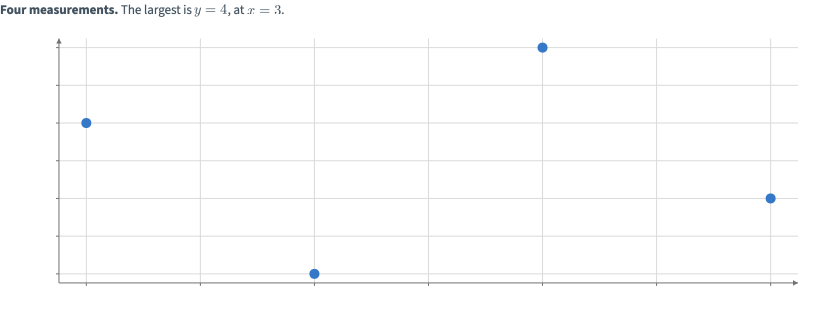
Static preview; loading the interactive plot
import hmplot as hm

data = {"x": [1, 2, 3, 4], "y": [3, 1, 4, 2]}
with hm.Scene() as scene:
    hm.Markdown("**Four measurements.** The largest is $y = 4$, at $x = 3$.")
    with hm.Plot(data=data, height=300, axes2d=True):
        hm.Points(x="x", y="y")
scene
Usage
In a Python scene, hm.Markdown(text) sits in a Scene, Row, Column or Grid beside plots: CommonMark with GitHub’s tables, strikethrough, task lists, autolinks and footnotes, and $math$ or $$math$$ typeset by MathJax. Raw HTML is not rendered, and links keep only http(s), mailto and tel URLs. The block takes the theme’s font and text color; width, fontSize, color, font and align override them. {$name} shows an input’s value as the input shows it (in an f-string, {{$name}}).