Group
One row per value (or combination of values) of the `by` columns, with the group's count, sums, means or other reductions.
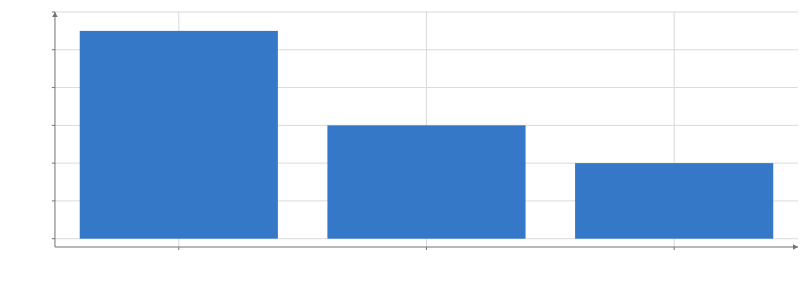
Static preview; loading the interactive plot
import hmplot as hm

data = {
    "fruit": ["apple", "pear", "apple", "plum", "pear", "apple"],
    "amount": [3, 5, 2, 4, 1, 6],
}
with hm.Plot(data=data, height=300, axes2d=True) as plot:
    with hm.Group(by="fruit", columns={"total": hm.sum("amount")}):
        hm.charts.Bar(x="fruit", y="total")
plot
Usage
Outputs the grouping keys, a count of each group’s rows, and the columns you name, not every input column. count is reserved for the built-in output: do not also put count in columns. Use that output directly, or give another count reduction a different name, such as columns={{ flights: count() }}. Each column is a reduction expression, the same ones Calculate uses: columns={{ mean_delay: mean("delay") }} (Python columns={"mean_delay": hm.mean("delay")}). Any reduction works (count, sum, mean, min, max, first, last, variance, std, median, mode, any, all), as does arithmetic of them, such as divide(sum("x"), count()), and where to reduce only some rows. Every reduction in a column reduces each group’s rows, so it takes no by of its own; a column read outside a reduction must be a key. Group is an aggregation operation; Mapping shares visual properties.
Without by, Group writes one row of totals over the visible rows, shown even when no row is (a count of 0), as SQL’s aggregate without GROUP BY or pandas’ agg() do: a live total for a Text, hm.Group(columns={"fare": hm.mean("fare")}) under a brush’s Filter.
A key can also be a bin or a hexagon. by={bin("delay", 20)} (Python by=hm.bin("delay", 20)) groups the rows by their bin of delay, binned as Bin bins it: a count, a rule such as "sturges", or explicit edges, with interval and tz for a datetime column. The output has the bin’s edges and center, delay0, delay1 and delay, in place of the key. by={hexbin("lon", "lat", { radius: 0.5 })} (Python hm.hexbin("lon", "lat", radius=0.5)) groups them by Hexbin’s hexagons and writes each hexagon’s center as lon and lat. Either can sit beside column keys, by={["carrier", bin("delay", 20)]}, and there is a row for each combination with a visible row. Bins follow the visible rows, as Bin’s do.
To let the viewer change a setting, read an input in it: by={input("by")} (Python by=hm.input.by), where by is a Select of column names.
For repeated locations, group by the location ID, coordinates and tooltip names before drawing Points: hm.Group(by=["origin", "lon", "lat", "name"], columns={"flights": hm.count()}) in Python. This draws one point per location while a brush on its plain coordinate keys selects every contributing event. A brush on the source events highlights their groups. Keep an event-level histogram outside Group, and use separate selection resources when the map filters the histogram and the histogram highlights the map. Plain keys retain this connection after as renames; computed bin centers and reduced columns do not represent unchanged source coordinates.