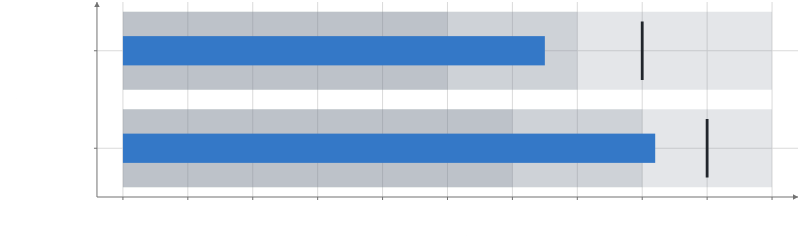
Actual values, target ticks and supplied qualitative ranges on categorical rows.
Options
Keywords are snake_case.
Options
targetchannel- Optional target value for each bullet.
fieldscolumn[]- Columns of cumulative qualitative upper bounds, all at or above baseline.
baselinenumber- The common starting value for actual and range bars. Default:
0. band_fractionnumber- The share of a category band occupied by the actual bar. Default:
0.3. rangesobject- Props of the background Bar part, such as fill, fill_scale and opacity.
tickobject- Props of the target Prism part, such as fill, width and depth.
datatable- A table for this chart alone.
Position
xchannel- The actual value for each bullet.
ychannel- Each bullet's category along y.
Appearance
fillchannel- The fill color: a CSS color, or a column of numbers or categories mapped to colors.
opacitychannel- The opacity, 0 to 1: a number, or a column (categories map through opacity_scale). Default:
1. outline_colorchannel- The outline's color: a CSS color, or a column of categories mapped through outline_color_scale.
outline_opacitychannel- Border opacity from 0 to 1: a number, numeric column, array or expression. Fades the border over the fill; mark opacity still applies to both. Missing values hide the border. Default:
1. outline_widthchannel- The outline's width in CSS pixels, drawn inside the mark's edge (a point's at most its radius). Default:
0.
Scales
fill_scalescale- The fill's scale, which marks can share: continuous({domain, colormap, transform}) for numbers, categorical({domain, range}) or ordinal() for categories.
outline_color_scalescale- A categorical() scale from the outline_color column's categories to colors.
opacity_scalescale- A categorical() scale from the opacity column's categories to opacities, 0 to 1.
Display
labelstring- The mark's name in the legend and the settings pane.
legendboolean- Whether the mark has a legend entry. Default:
True. visibleboolean- Whether the mark is drawn. Default:
True. domainsboolean- Whether the mark's data counts toward its axes' automatic domains; false leaves them to the other marks (a reference line, a decorative part). Default:
True. blend"normal" | "additive" | "multiply" | "screen" | "subtractive"- How the mark mixes with what is drawn under it; any mode but normal draws it transparent, and SVG and PDF exports draw additive and subtractive as an image. Default:
"normal". glownumber- How much the mark glows: its own color times glow blooms around it in the plot's presentation (0 does not glow); the Plot's bloom effect sets the bloom's strength and radius. SVG and PDF exports draw the whole plot as an image. Default:
0. shadeShadeSpec- A plugin's shade (registerPlugin): { kind, ...parameters }, as { kind: "hatch", spacing: 6 } (Python hm.shade("hatch", spacing=6)), recolors each fragment the mark draws; picking, tooltips, domains and legends are unchanged. SVG and PDF exports draw a shaded mark as an image.
optionsstring[]- The settings the settings pane shows for this mark, by name.
namestring- The mark's name in the settings pane, and the name facet.endpoint() and partition.endpoint() find it by.
Interaction
identityidentity- Whose rows these are for selections: an identity() shared by tables that show the same things. Default: its data's.
selectboolean | selection | object- Click to replace the selection; an exact repeat clears it. Shift/Meta/Ctrl-click toggles membership (whole series for Line, Area): true uses its data's selection, or give a selection(). input("root").set("id") writes an input instead: a click sets it to the clicked row's id (a drill-down's root), .set(literal(v)) to a constant, .reset() to its default, and a click on nothing restores its default (input("root", {default}), else a Select of that name's, else null); several marks may write one input.
hoverboolean | selection | object- Mark the row under the pointer as @hovered (a whole series for Line, Area), without fading the others: true uses its data's hover, or give a selection(). input("focus").set("series") writes an input instead: while the pointer is on a row the input shows its series (or .set(literal(v)), a constant), then its committed value again (a hover that would change this mark's own rows is an error).
tooltipboolean | field[] | object- Show the nearest row's values in a box by the pointer: true, a list of fields, or {fields, radius, content}. Default: the Plot's.
nearestboolean | selection | object- Mark the row a tooltip shows as @nearest, with or without the tooltip: under the pointer, else the nearest drawn row within radius pixels (a whole series for Line, Area): true, a selection(), or {selection, radius}. Default: the Plot's.
respondboolean | "selected" | "brushed" | "hovered" | "nearby" | "nearest" | selection | array- Which interaction states fade this mark's other rows to selection_opacity; "hovered" fades them while hovering, "nearest" while a row is nearest. Default: the states it sets, except hover and nearest.
selection_opacitynumber- The opacity of the rows outside the selection while one is active. Default:
0.25. enter_effectboolean | "fade" | object- How rows that arrive in a keyed update appear: "fade", or {effect, duration, easing}. animate()'s enter option is the value a channel starts from.
exit_effectboolean | "fade" | object- How rows that leave in a keyed update disappear, as enter_effect. animate()'s exit option is the value a channel ends at.
Animation
animationboolean- Animate changes to the mark's values. Default:
False. animation_durationnumber- How long an animated change takes. Default:
300 ms. animation_easing"linear" | "quad-in" | "quad-out" | "quad-in-out" | "cubic-in" | "cubic-out" | "cubic-in-out" | "sine-in-out"- The animation's easing. Default:
"cubic-in-out".
Legend settings
legend_font_sizenumbersetting- The size of the mark's legend text. Default: the theme's (14 in the default theme). In px.
legend_font_familystringsetting- The font of the mark's legend text, a CSS font-family. Default: the plot's font.
legend_text_colorcolorsetting- The color of the mark's legend text. Default:
"#40505d". legend_tick_formatstringsetting- How a colorbar labels numbers: a d3-format string, or a %-pattern for dates. Default:
".3~g".
Color settings
quantizebooleansetting- Step a numeric fill or color into `levels` colors instead of a smooth gradient. Default:
False. levelsnumbersetting- How many colors quantize steps through. Default:
10.
Limits
max_elementsnumbersetting- The most rows the mark prepares on the GPU. Default:
250000.
The mark's own axes
x_transform"linear" | "log" | "sqrt" | "symlog"setting- This mark's own x transform, instead of its frame's. Default: its frame's.
x_invertbooleansetting- Reverse this mark's x direction. Default:
False. xbounds[number, number]setting- The x extent this mark maps, instead of its frame's domain (an image's or a grid's extent). Default: its frame's.
xrange[number, number]setting- Where this mark's x extent lands, in its frame's world units. Default: its frame's.
y_transform"linear" | "log" | "sqrt" | "symlog"setting- This mark's own y transform, instead of its frame's. Default: its frame's.
y_invertbooleansetting- Reverse this mark's y direction. Default:
False. ybounds[number, number]setting- The y extent this mark maps, instead of its frame's domain (an image's or a grid's extent). Default: its frame's.
yrange[number, number]setting- Where this mark's y extent lands, in its frame's world units. Default: its frame's.
z_transform"linear" | "log" | "sqrt" | "symlog"setting- This mark's own z transform, instead of its frame's. Default: its frame's.
z_invertbooleansetting- Reverse this mark's z direction. Default:
False. zbounds[number, number]setting- The z extent this mark maps, instead of its frame's domain (an image's or a grid's extent). Default: its frame's.
zrange[number, number]setting- Where this mark's z extent lands, in its frame's world units. Default: its frame's.
Shading
transparentbooleansetting- Draw the mark in the transparent pass, blended in depth order with other transparent marks. Default:
False.