Frame
A coordinate frame inside a Plot: its own scales for some marks (a second y axis), or a small chart placed within its parent.
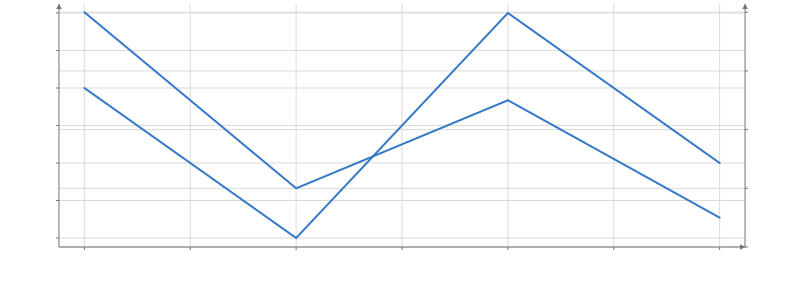
Static preview; loading the interactive plot
import hmplot as hm

data = {"x": [1, 2, 3, 4], "y": [3, 1, 4, 2], "count": [40, 10, 25, 5]}
with hm.Plot(data=data, height=300, axes2d=True) as plot:
    hm.Line(x="x", y="y")
    with hm.Frame(y={"domain": "auto", "side": "right"}):
        hm.Line(x="x", y="count")
plot
Usage
Each dimension inherits its parent’s scale unless you give it a domain, “auto”, or a range. A dimension with its own domain is linear unless you set transform, even inside a log or sqrt parent; a range-only dimension keeps the parent’s transform. A range places the child in parent data coordinates, composed through linear, log, and sqrt ancestors. placement anchors a fixed-size frame at a parent data position (CSS pixels in 2D, world units in 3D) with optional rotation. Moving a placement moves the frame and re-prepares nothing inside it; in a Python scene its numbers may be expressions of inputs, evaluated as they change ({"anchor": [8 * hm.cos(hm.input.day / 58), 0, 0], ...}: the gallery’s solar system orbits its planets this way). placement="fit" centers the frame in a Cartesian parent’s domain (at the middle of each axis as drawn, on log, sqrt and symlog axes too), across 90% of the parent’s shorter side, and refits it as the parent pans, zooms or resizes; a Pie places its own polar Frame this way.
Shift-drag on a child frame’s tick strip brushes the column its marks plot on that axis, counting the marks of frames inside it that inherit that axis; a twin axis (a child with its own axis and no range) brushes on its own strip too. The band is drawn only on the strip, and a column shared with other strips shows the same band on each; editing any of them edits the one constraint.
A child frame’s axis titles follow its own dimensions: one it owns is titled by its own label, else by the column its marks plot on it; one it inherits is titled by the frame it inherits from, where its marks’ columns count (see Frame axis titles).
Child axes are drawn on the child’s own boundary; inherited dimensions do not duplicate their axes. A dimension a child owns draws its axis once it has a domain: one you give, or the extent of the marks that plot on it. Until then it draws no axis, so a range-only child whose marks all sit in a Frame inside it that sets its own x (a Frame in every facet cell, say) shows only its y axis.
Animated scales
Set animateBounds={true} on a Frame to transition numeric x, y, and z domains and
ranges, including inferred domains. boundsDuration (milliseconds) and boundsEasing configure scale transitions independently of mark animation. Nested Frames inherit these
scale settings; child marks retain their own animation, animationDuration, and animationEasing settings. Plot accepts the same bounds controls for its implicit frame.
Python uses animate_bounds, bounds_duration, and bounds_easing.
Transitions start from the layout currently displayed, including when interrupted. Guides, marks, picking, masks, and PNG/SVG/PDF exports all read that displayed mapping. A frozen animation clock freezes scales too. Initial layout, categorical scales, changes of transform, and interval direction reversals arrive immediately instead of interpolating through an invalid or zero-width scale. Scale endpoints interpolate in data units. Placement and projection parameters are not animated by this option.
The Streamgraph example transitions its inferred scale and areas together, with equivalent Svelte and Python programs.
<Frame animateBounds boundsDuration={700} boundsEasing="cubic-in-out"
  y={{ domain: [0, maximum] }}>
  <Area x="time" upper="value" />
</Frame>
Axis borders and masks
axisFrame={true} adds a complete border to a rectangular 2D Cartesian frame. It does not add duplicate ticks or labels on the opposite edges. Set each axis’s line independently to hide its baseline while retaining ticks, titles, or arrows.
axisMask={true} clips data to the axes interior, including parts of large points, thick lines, fills, and data text that cross an edge. The hmplot theme enables masking; minimal leaves it off. Use axisMask={false} to allow overflow from this frame. An enabled ancestor mask still applies, so a child cannot draw outside a masked parent. Nested ranged frames, rotated Cartesian placements, and facet cells use their own boundaries.
Masks work even when axis lines are hidden. They leave guides, titles, legends, brush handles, and controls visible. Hidden fragments cannot be picked, and visible fragments retain their normal interactions. Brushing continues to store constraints in data units; masking does not filter the underlying table or clear an existing selection when you pan.
PNG uses the same fragment mask as the screen; SVG and PDF use matching clip paths, preserving transparent margins. This option supports rectangular 2D Cartesian surfaces. Theme masks are ignored on polar, spherical, and 3D frames; explicitly enabling axisMask or axisFrame there reports an error. Python uses axis_mask and axis_frame.
invert: true on an axis definition flips its direction on screen — the domain runs top-to-bottom for y, right-to-left for x, near-to-far for z. It is a reversed output range, so automatic domains, log and sqrt transforms, brushing, nearby picking, and ticks all keep working; the settings pane shows it as an Invert checkbox next to the transform. Explicit domains override inference; hidden decorations do not disable the scale. scaleDefaults configures automatic appearance mappings for compatible data channels.
Atmosphere
atmosphere on a spherical Frame in a 3D plot draws a glowing rim around its globe: atmosphere (true) or atmosphere={{ color: "#7fb2ff", thickness: 0.1 }}, the thickness a fraction of the globe’s radius. It is a slightly larger sphere seen from inside, added onto what is behind it, brightest at the globe’s edge and fading outward; it moves with a placed Frame. It is not a mark: it is not picked, it sets no axis domain and has no legend. The solar system example gives the Earth one. PNG exports include it; SVG and PDF exports draw the whole plot as an image (see the note above).
Axis titles
An axis is titled by its label; without one (an empty label or null means automatic), by a categorical position scale’s label (categorical({label})), else by the name of the one column its marks plot there. Names follow aliases and transform outputs: a Facet over fields titles each cell’s axis by its field (the column value is that field), a Bin’s edges and a Histogram’s bars by the binned column, a Histogram’s height by its normalization (count, proportion or density), and Bar, BoxPlot, Violin and Lollipop by the columns you give them. Constants (a baseline of 0, a Text at x={5}) do not count. An axis whose marks plot several different columns, raw arrays, expressions, or nothing has no title at all; set label, or hide every title with axisTitles={false}. A Frame that sets its own domain, range, transform or scale for a dimension reads only its own label (a twin y axis is not titled by the Plot’s label), and a dimension a Frame inherits is titled by the frame that owns it. The 3D box uses the same titles. Automatic titles are never stored as settings: the settings pane shows them as the label’s placeholder, and Reset returns to them.
animationGroup (animation_group in Python) on Data, Plot or Frame matches animated
rows by a column or list of columns independently of Data keys. It inherits through the
tree; a child Frame overrides its branch, and explicit null (Python None) restores
Data-key/position matching. Filter to one row per group before tweening: a country/year
table can keep key=["country", "year"] and animate by "country" after filtering
to one year. Groups must be unique in each tweened snapshot, and changing the group
column scheme resets motion history. Selection, hover and connections keep Data identity.