Slice
Each entity's values at one time (or other coordinate), interpolated between its observations, or one slice of a grid table.
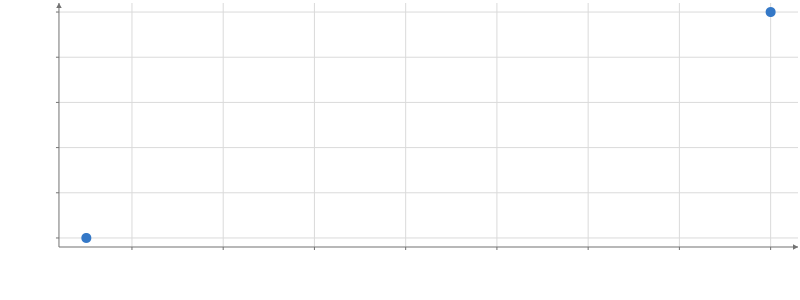
Static preview; loading the interactive plot
import hmplot as hm

data = {
    "id": ["a", "a", "a", "b", "b", "b"],
    "time": [0, 1, 2, 0, 1, 2],
    "x": [1, 2, 4, 3, 2, 1],
    "y": [1, 3, 2, 4, 3, 1],
}
with hm.Plot(data=data, height=300, axes2d=True) as plot:
    with hm.Slice(field="time", at=1.5, by="id"):
        hm.Points(x="x", y="y")
plot
Usage
Outputs one interpolated row per entity with keys and requested fields. Numeric values interpolate linearly; categories choose the nearer endpoint. Key/time pairs must be unique. Entities without a bracket are omitted; exact endpoint observations remain.
Over a grid table (see Data, “Grid tables”) sliced through one of its dimensions, with by omitted or naming the others, Slice blends the two slabs around at on the GPU and outputs a grid table of the other dimensions: slicing time gives a map, slicing a latitude a Hovmöller diagram. A Playback on at reads nothing back. Outside the coordinates every cell is hidden.
To let the viewer change a setting, read an input in it: at={input("time")} (Python at=hm.input.time), where time is a Playback from min("time") to max("time").