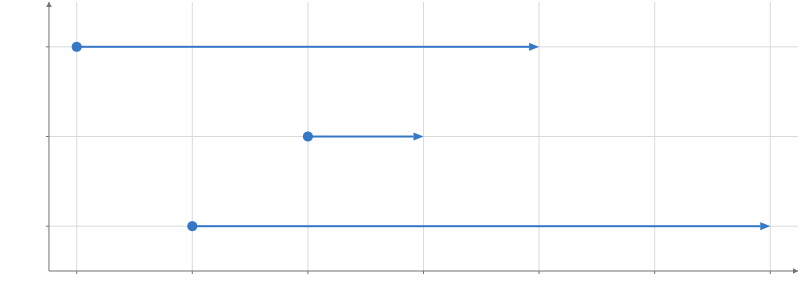
An invisible position that connections from a Line, Segments or Arrows attach to.
Options
Keywords are snake_case.
Options
xchannel- The x position of each row: a column, per-row values, or one value.
ychannel- The y position of each row: a column, per-row values, or one value.
zchannel- The z position, in a 3D plot: a column, per-row values, or one value.
positionchannel- Positions as one column or an N x 2 (or N x 3) array, instead of x, y and z.
namestring- The name facet.endpoint() and partition.endpoint() select this Anchor by when a Facet or Partition repeats it (Python can pass the Anchor itself); also its label in the settings pane.
identityidentity- Whose rows these are: connect() without a key matches the rows of endpoints that share an identity(). Default: its data's.
enter_effectboolean | "fade" | object- In a keyed update, arriving rows start from their channels' animate(..., {enter}) values; an Anchor draws nothing, so "fade" only sets the timing.
exit_effectboolean | "fade" | object- In a keyed update, leaving rows stay in place, and connectable, until the transition ends.
animationboolean- Animate changes to the positions, so what is connected to the Anchor moves smoothly. Default:
False. animation_durationnumber- How long an animated change takes. Default:
300 ms. animation_easing"linear" | "quad-in" | "quad-out" | "quad-in-out" | "cubic-in" | "cubic-out" | "cubic-in-out" | "sine-in-out"- The animation's easing. Default:
"cubic-in-out". datatable- A table for this Anchor alone; unlike other marks, an Anchor with data still goes inside a Plot.
Limits
max_elementsnumbersetting- The most rows the mark prepares on the GPU. Default:
250000.
The mark's own axes
x_transform"linear" | "log" | "sqrt" | "symlog"setting- This mark's own x transform, instead of its frame's. Default: its frame's.
x_invertbooleansetting- Reverse this mark's x direction. Default:
False. xbounds[number, number]setting- The x extent this mark maps, instead of its frame's domain (an image's or a grid's extent). Default: its frame's.
xrange[number, number]setting- Where this mark's x extent lands, in its frame's world units. Default: its frame's.
y_transform"linear" | "log" | "sqrt" | "symlog"setting- This mark's own y transform, instead of its frame's. Default: its frame's.
y_invertbooleansetting- Reverse this mark's y direction. Default:
False. ybounds[number, number]setting- The y extent this mark maps, instead of its frame's domain (an image's or a grid's extent). Default: its frame's.
yrange[number, number]setting- Where this mark's y extent lands, in its frame's world units. Default: its frame's.
z_transform"linear" | "log" | "sqrt" | "symlog"setting- This mark's own z transform, instead of its frame's. Default: its frame's.
z_invertbooleansetting- Reverse this mark's z direction. Default:
False. zbounds[number, number]setting- The z extent this mark maps, instead of its frame's domain (an image's or a grid's extent). Default: its frame's.
zrange[number, number]setting- Where this mark's z extent lands, in its frame's world units. Default: its frame's.
Usage
An Anchor is a positional mark that draws nothing. It takes x/y/z or position like a point mark (columns, expressions, numbers, arrays, or values inherited from a Mapping), contributes to automatic domains and Fit, keeps stable source identities across keyed updates, and animates its channels with animate(). It has no geometry, no picking target, and no legend entry, and it never fades or animates visibility on its own.
Anchors are endpoints for connections: pass one (or anchor.endpoint(), a method of its AnchorHandle, whose only attachment is center) to connect() to attach a Line, Segments, Arrows3D, or Arrows to its positions. When an embedded Facet or a Partition repeats it in every cell, give it a name to select it in Svelte (facet.endpoint("values")); in Python pass the Anchor itself, hm.connect(values, key="id"). An Anchor is also the way to attach a connection where no other mark offers an attachment (a Line vertex, an area boundary, a map feature), and to widen an automatic domain without drawing anything.
An Anchor has nothing to pick, so select, hover, brush, nearby, respond, and pointer handlers are an error: put them on a visible mark and connect to it. Appearance props do not apply, and a Mapping’s appearance channels skip it.
An Anchor is for positions where nothing should be drawn. When the endpoints are visible marks (the points in every cell of parallel coordinates, say), connect those marks directly.
In the example, the 2021 values are an Anchor: only the arrowheads mark them, and each arrow starts at its country’s gray 2000 point.