VectorTile
A basemap of land, water, roads, buildings and place names from vector map tiles.
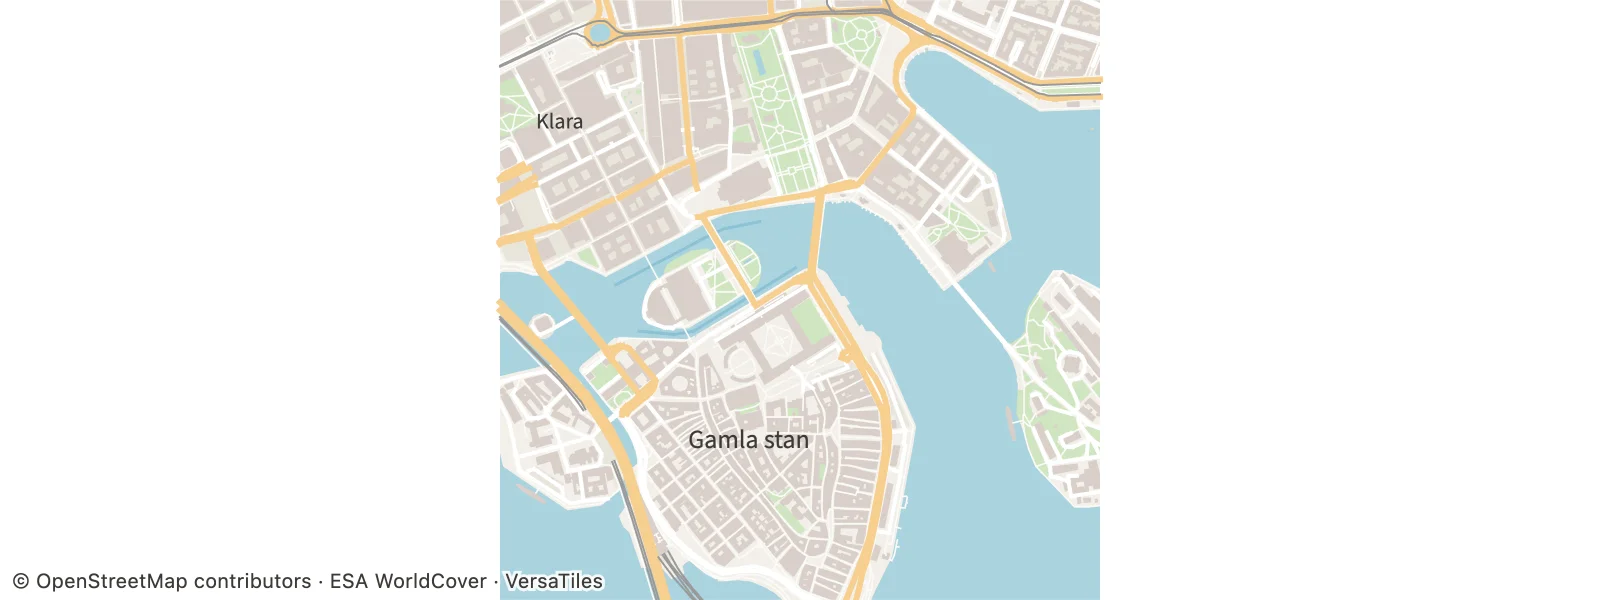
Static preview; loading the interactive plot
import hmplot as hm

with hm.Plot(coordinates="spherical", projection="mercator", tone_mapping=0, height=300) as plot:
    hm.VectorTile(tile=[14, 9014, 4818], live=False)
plot
Usage
VectorTile loads Mapbox Vector Tiles that you name by their coordinates, tile={[z, x, y]}, a list of tiles, or a longitude/latitude bounds box at a zoom, from a url template with {z}, {x} and {y}. It decodes them and draws them as a basemap: land and parks, water, buildings, roads, railways, boundaries and place names, each a part with its own style. Put it in a 2D map (coordinates="spherical" projection="mercator"); the map frames the tiles, and other marks overlay them in longitude and latitude.
In a 2D view (a Cartesian plot, or a map in any projection, the globe included) the basemap is live by default: as the camera moves, the tiles it shows load at the nearest zoom, over the requested tiles, which stay where live tiles fail. Roads, landuse and place names show by zoom and kind, as VersaTiles’ own style shows them, and names that would overlap are left out. Live tiles need opaque styles; minZoom and maxZoom bound their zoom. Inside nested Frames, in 3D views other than the flyover below, and with live={false}, the requested tiles load once and pan and zoom move over them.
Under a 3D flyover camera (type="3d" cameraMode="flyover", the tiles in a local plane with origin, unitsPerMeter and plane="xz", and linear axes) the basemap lies flat on the ground and is live too: the tiles of a square of about four camera heights around the camera load, at a zoom from the camera’s height, and the overview and the plot’s fog cover the distance a low camera sees past them. The buildings of the tiles that have them stand up (extrudeBuildings, default true; “3D buildings” in the settings pane): height meters tall above min_height as VersaTiles’ zoom-14 tiles tag them, 5 meters without a height, flat roofs, the buildings’ fill shaded. extrudeBuildings={false} draws flat footprints, and styles={{ buildings: false }} hides both. With live={false} the requested tiles draw the same way and nothing else loads. 2D maps are always flat. See docs/VECTOR-TILES.md, “Live tiles under a 3D flyover”. A new tile list loads at once, supersedes a load in flight, and replaces the tiles on screen when it arrives. attribution puts a credit line in the plot’s lower-left corner, kept in every export. The default tiles’ credit is short (OpenStreetMap and ESA WorldCover); ESA’s full form, ”© ESA WorldCover project 2021 / Contains modified Copernicus Sentinel data (2021) processed by ESA WorldCover consortium”, belongs in a publication’s credits or a page’s footer (THIRD_PARTY_NOTICES.md lists every source’s terms). styles hides or restyles parts without a reload; sourceLayers assigns a custom tileset’s layers to parts. In Svelte markup, pass the URL template as a JavaScript string, url={"https://.../{z}/{x}/{y}.pbf"}. bind:this gives a VectorTileHandle: whenSettled() resolves once the requested loads are drawn (or failed), getResult() returns the tiles on screen and their decoded features (outside live mode), getTileData() the tiles’ bytes as tileData carries them, getParts() each part’s GeoJSON mark, and getStatus() the load state, with the live zoom and tile counts. See docs/VECTOR-TILES.md.
zoomBias adjusts live detail at the same view scale or flyover height: +1 asks for
twice the linear detail, -1 for coarser tiles, and 0 keeps automatic selection. Pass a
finite number between -4 and 4. minZoom, maxZoom and the live tile budget still apply,
so increasing detail cannot load unlimited tiles. The settings pane calls this Tile detail.
Python uses zoom_bias.
HTML that opens offline and stays live online
Keep snapshot enabled (the default) on VectorTile. live=true controls fetching new tiles
while navigating; it does not disable embedding. Python’s hm.export_html normally draws
in headless Chrome and embeds the requested tiles and currently visible live tiles as tileData, while keeping url and live for online navigation:
with hm.Plot(coordinates="spherical", projection="mercator") as chart:
    hm.VectorTile(tile=[14, 8157, 6111], live=True)  # snapshot=True by default
hm.export_html(chart, "chart.html")
The export browser must be able to load the initial tiles. If it cannot reach the service,
provide local MVT bytes with tile_data=[{"tile": [z, x, y], "bytes": tile_bytes}] (JavaScript: tileData). Include the requested tiles and any surrounding area needed offline. The
embedded area remains visible offline; navigating beyond it needs the tile service.
VectorTile(snapshot=False) deliberately leaves externally loaded tile bytes out of the
page. It requires network access when opened. The separate hm.export_html(..., snapshot=False) skips the headless snapshot/export pass, so externally loaded tiles cannot be captured then
either. Neither option is suitable for making a network-sourced basemap self-contained.
A tile-fetch failure during export means there are no downloaded bytes to embed: keep the
offline requirement, supply local tile bytes or restore service access, and export again.