HMPlot

Playback

A slider with play, pause and reset buttons that moves its value over time, read by name.
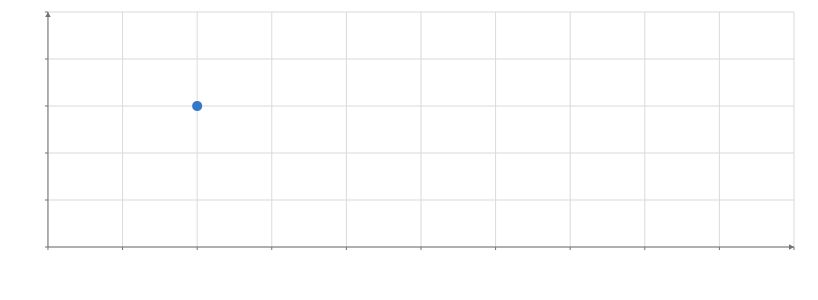
Scatter plot of y against x. x from 0 to 5, y from 0 to 5. 1 point.

Static preview; loading the interactive plot

import hmplot as hm

data = {"x": [1, 2, 3, 4], "y": [3, 1, 4, 2]}
# Play shows the points up to x = until, one more each second.
with hm.Scene() as scene:
    hm.Playback(name="until", min=1, max=4, step=1)
    with hm.Plot(data=data, height=300, axes2d=True, x={"domain": [0, 5]}, y={"domain": [0, 5]}):
        with hm.Filter(where=hm.col.x <= hm.input.until):
            hm.Points(x="x", y="y")
scene

Options

Keywords are snake_case.

ratenumber | string | {unit, step}
How fast play moves the value, in value units per second; over Dates, a calendar interval per second ("1 day") or milliseconds per second. Default: 1.
loopboolean
Wraps back to min at max instead of stopping. Default: False.
autoplayboolean
Starts playing when it mounts, unless the viewer prefers reduced motion. Default: False.
playingboolean
Plays (true) or pauses (false) it from code; Python has play() and pause().
resetnumber | string
Each change of its value returns it to its first value (a Button's count works); Python has reset().
minnumber | Date | expression
The low end of the range: a number, a Date, or an expression such as min("t") over the data around it. Default: 0.
maxnumber | Date | expression
The high end of the range: a number, a Date, or an expression such as max("t"). Default: 1.
stepnumber | string | {unit, step}
The distance between values: play moves one step every step/rate seconds, or every frame without one. Over Dates, a calendar interval such as "1 month" or milliseconds. Default: any value.
valuenumber | Date | expression
The first value, where play starts and reset returns; an expression reads it from the data. Default: min.
formatstring | (value) => string
How the value is shown: a d3-format string such as ".2f", a %-pattern such as "%b %Y" over Dates, or (in JavaScript) a function. Default: a numeric step's decimals, else 4 significant digits (12,346); over Dates, by the step, as an axis labels them.
timezonestring
Over Dates, the time zone its steps and labels are in: an IANA name, "UTC" or "Local". Default: the zone of the datetime column min or max reads, else UTC.
namestring
The name readers use (input("name"), hm.input.name, or "$name" where a string names a column): an identifier, unique in its input context.
labelstring
The text shown beside the control. Default: the name.

Usage

An input sends its value up to the nearest input context (an InputContext, a Python Scene, or a Template instance), and everything in that context reads it by name: input("name") in JavaScript, hm.input.name in Python, or the string "$name" where a string names a column. A read is replaced by the value before its reader sees it, so moving an input re-runs its readers once, and the change animates like any other data change. Inputs go beside Plots (in a Row or Column), not inside them.

Related examples

Inputs

Calendar functions and a Playback over dates