Inputs
A Select, a Playback and a Slider drive a Filter and a Bin by name; the options and a range are read from the data.
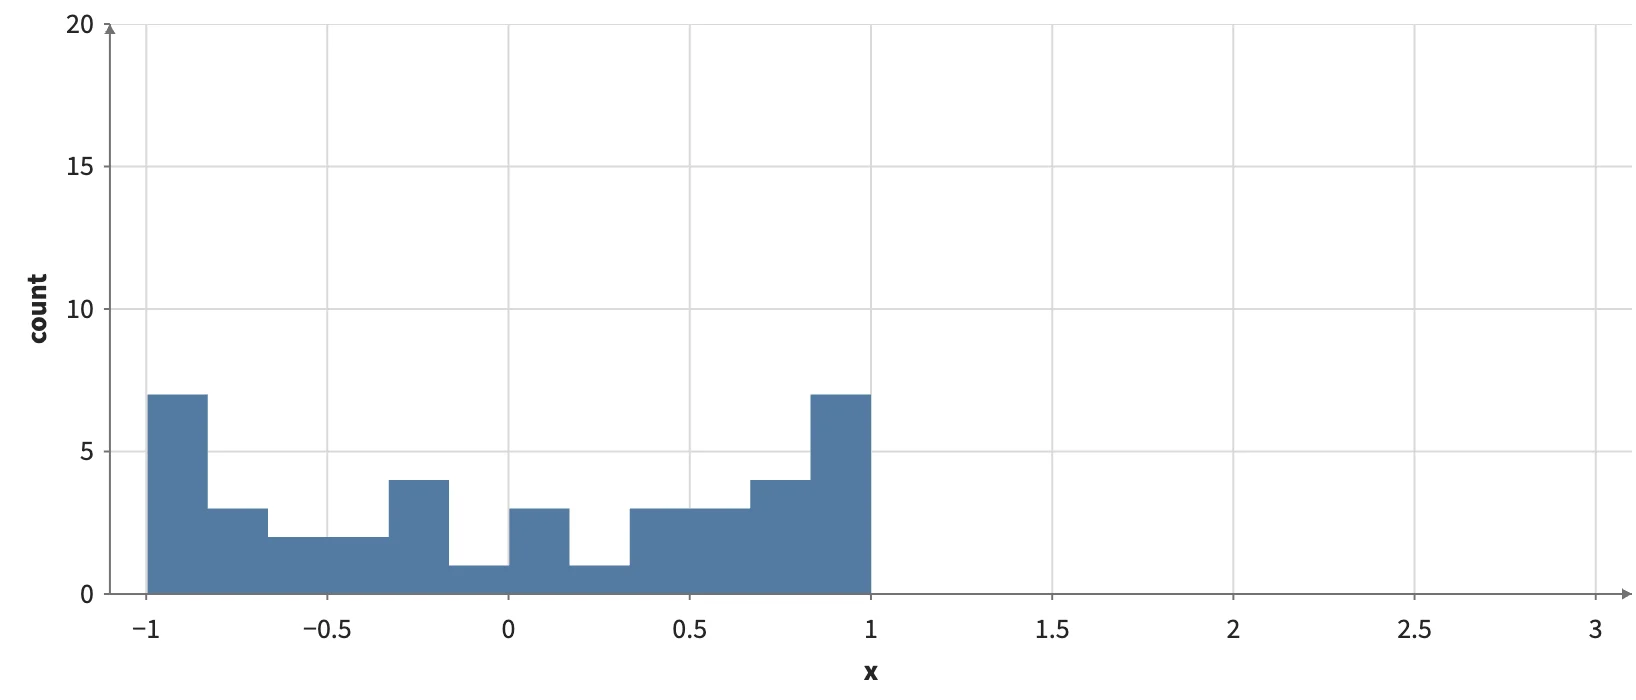
Static preview; loading the interactive plot
<InputContext><Data value={observations}>
  <Select name="species" options={categories("species")} />
  <Playback name="start" min={min("x")} max={max("x")} rate={0.5} loop />
  <Slider name="bins" min={4} max={40} step={1} value={12} />
  <Filter where={logical_and(equal(col("species"), input("species")), greater_equal(col("x"), input("start")))}><Plot>
    <Bin x="x" bins={input("bins")}><Rect x0="x0" x1="x1" y0={0} y1="count" /></Bin>
  </Plot></Filter>
</Data></InputContext>