Interaction matrix and scrolling
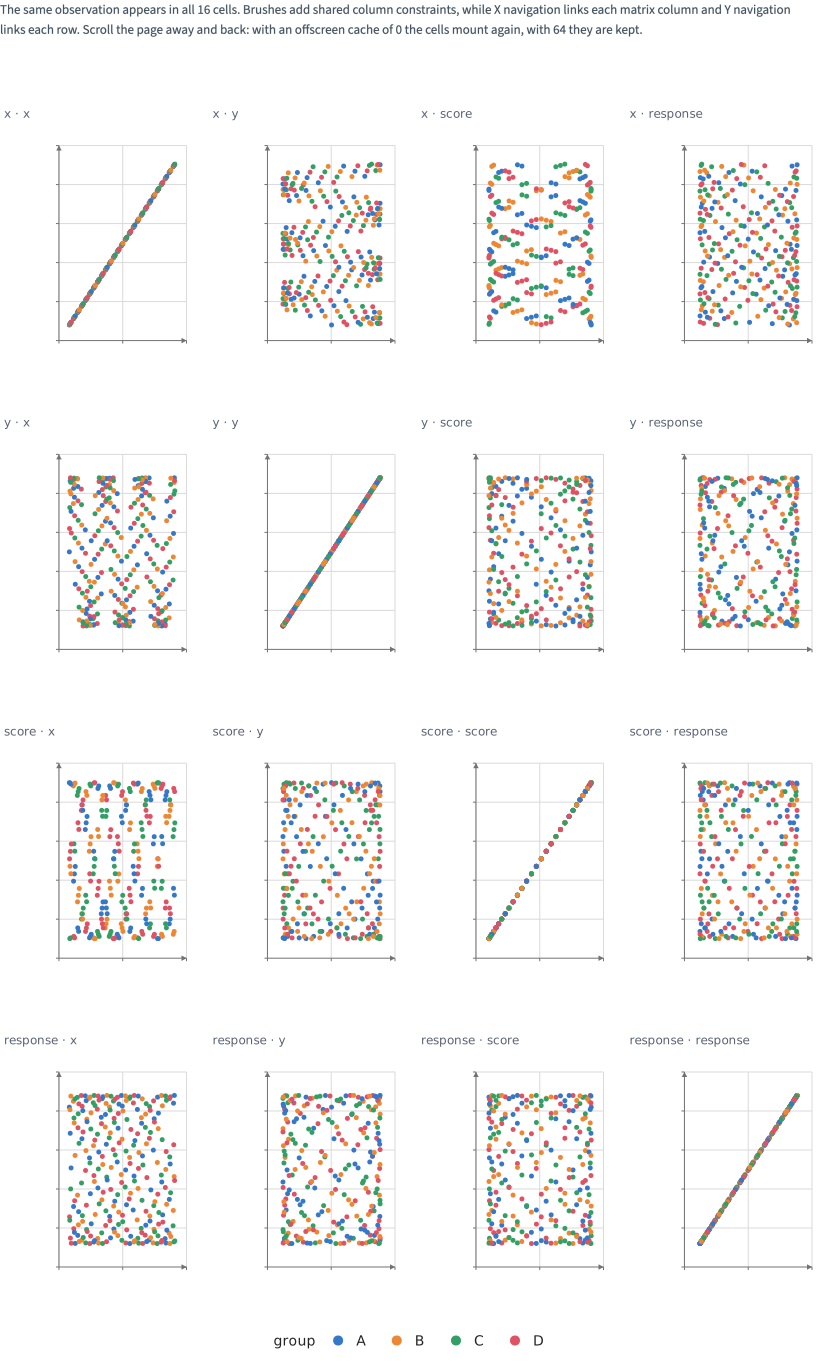
The same observation appears in all 16 cells. Hover should enlarge it everywhere; selection and brushing should coordinate by row, not category. Scroll away and back, then repeat. Compare cache sizes 0 and 64. Pan and zoom are independent in this example.
Static preview; loading the interactive plot
<script>
  import { InputContext, Select, Data, Facet, Plot, Points, where } from "hmplot";

  // 256 rows in four groups and four fields, each row a point in all sixteen cells of the matrix.
  const n = Array.from({ length: 256 }, (_, i) => i);
  const records = {
    id: n.map((i) => `row-${i}`),
    group: n.map((i) => ["A", "B", "C", "D"][i % 4]),
    x: n.map((i) => 0.08 + 0.84 * ((i * 37) % 997) / 996),
    y: n.map((i) => 0.5 + 0.38 * Math.sin(i * 0.71)),
    score: n.map((i) => 0.5 + 0.4 * Math.cos(i * 0.29)),
    response: n.map((i) => 0.5 + 0.38 * Math.sin(i * 0.17 + 1)),
  };
  // A Facet's cache size is a prop of its own: the select sets it through `cacheSize`.
  let cacheSize = $state(64);
</script>

<InputContext>
  <p>The same observation appears in all 16 cells. Brushes add shared column constraints, while X navigation links each matrix column and Y navigation links each row. Scroll the page away and back: with an offscreen cache of 0 the cells mount again, with 64 they are kept.</p>
  <Select name="cache" label="Offscreen cache" options={{ "0 (remount)": 0, "64 (retain)": 64 }} bind:value={cacheSize} />
  <Data value={records} key="id">
    <Facet pairs={["x", "y", "score", "response"]} scales="field" link="grid" {cacheSize}>
      <Plot height={260} axes2d>
        <Points x="x" y="y" fill="group" size={where("@hovered", 11, 5)} hover select brush
          respond={["hovered", "selected", "brushed"]} />
      </Plot>
    </Facet>
  </Data>
</InputContext>