Polar radius
Angles and radial values in an explicit polar chart.
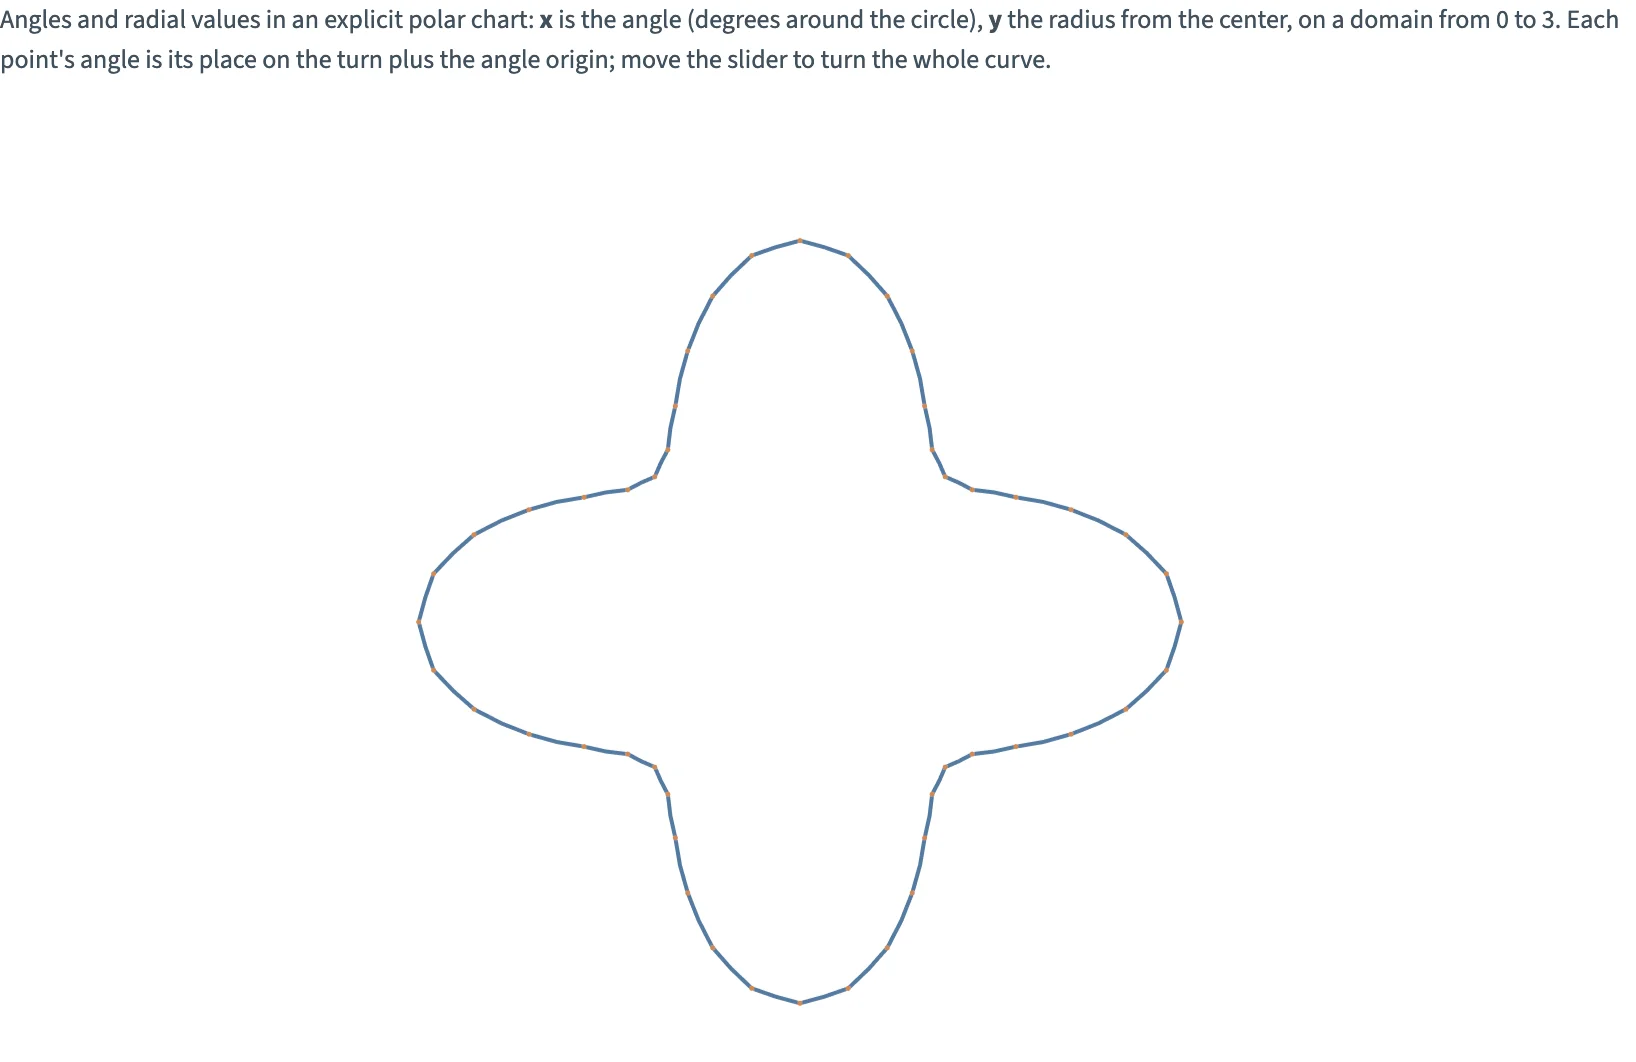
Static preview; loading the interactive plot
<script>
  import { InputContext, Slider, Data, Calculate, Plot, Line, Points, col, input, add } from "hmplot";

  // Forty-nine points on a polar chart: x is the angle around the circle (degrees), y the radius
  // out from the center. The radius rises and falls four times a turn; the slider moves where the
  // angles start, so the whole curve turns.
  const turn = Array.from({ length: 49 }, (_, i) => i * 7.5);
  const data = { turn, radius: turn.map((t) => 2 + 0.6 * Math.cos((t * 4 * Math.PI) / 180)) };
</script>

<InputContext>
  <p>Angles and radial values in an explicit polar chart: <strong>x</strong> is the angle (degrees around the circle), <strong>y</strong> the radius from the center, on a domain from 0 to 3. Each point's angle is its place on the turn plus the angle origin; move the slider to turn the whole curve.</p>
  <div class="controls">
    <Slider name="origin" label="Angle origin" min={-180} max={180} step={15} value={-90} />
  </div>
  <Data value={data}>
    <Calculate columns={{ angle: add(col.turn, input.origin) }}>
      <Plot coordinates="polar" baseRadius={0} radialScale={1} y={{ domain: [0, 3] }} height={440}>
        <Line x="angle" y="radius" width={2} color="#547ba2" />
        <Points x="angle" y="radius" size={2.5} fill="#cf8955" />
      </Plot>
    </Calculate>
  </Data>
</InputContext>

<style>
  /* Python's Scene(gap=12) and Row(wrap=True, min_width=0). */
  .controls { display: flex; flex-wrap: wrap; align-items: center; gap: 16px; margin: 12px 0; }
</style>