Coordinated interaction explorer
Coordinate hover, click selection, a movable brush, and filtered projections across three views.
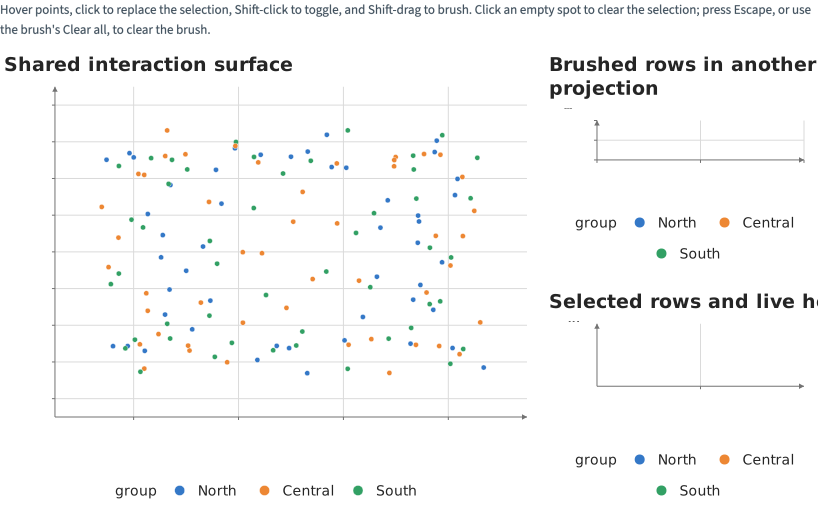
Static preview; loading the interactive plot
<script>
  import { Data, Plot, Points, Text, Filter } from "hmplot";

  // 144 people in three regions, placed by two features. In the large view, hover a point, click
  // to select (Shift-click toggles) and Shift-drag to brush. Beside it, the brushed rows in another
  // projection, and the selected rows with the hovered one, labeled.
  const regions = ["North", "Central", "South"];
  const observations = Array.from({ length: 144 }, (_, index) => {
    const region = index % 3, phase = index * 0.73 + region * 0.9;
    return {
      id: `P${String(index + 1).padStart(3, "0")}`,
      group: regions[region],
      x: 50 + 38 * Math.sin(phase) * (0.7 + (index % 11) / 36),
      y: 50 + 36 * Math.cos(index * 0.41 + region) * (0.72 + (index % 7) / 30),
      score: (Math.sin(index * 0.29) + 1) / 2,
      response: (Math.cos(index * 0.17 + region) + 1) / 2,
    };
  });
  const featureA = { domain: [5, 95], label: "Feature A" }, featureB = { domain: [5, 95], label: "Feature B" };
  // Shared side margins align the detail panels in this CSS layout and the Python version.
  const panelMargins = { axisMarginLeft: 52, axisMarginRight: 14 };
</script>

<p>Hover points, click to replace the selection, Shift-click to toggle, and Shift-drag to brush. Click an empty spot to clear the selection; press Escape, or use the brush's Clear all, to clear the brush.</p>
<Data value={observations} key="id">
  <div class="row">
    <div class="main">
      <Plot title="Shared interaction surface" height={460} axes2d x={featureA} y={featureB}>
        <Points x="x" y="y" fill="group" size={5.5} outlineColor="#ffffff" outlineWidth={0.35}
          select hover brush respond={["selected", "brushed", "hovered"]} selectionOpacity={0.1} />
      </Plot>
    </div>
    <div class="details">
      <div>
        <Plot {...panelMargins} title="Brushed rows in another projection" height={223} axes2d
          x={{ domain: [0, 1], label: "Score" }} y={{ domain: [0, 1], label: "Response" }}>
          <Filter where="@brushed" inactive="none">
            <Points x="score" y="response" fill="group" size={5} respond="hovered" selectionOpacity={0.2} />
          </Filter>
        </Plot>
      </div>
      <div>
        <Plot {...panelMargins} title="Selected rows and live hover" height={223} axes2d x={featureA} y={featureB}>
          <Filter where="@selected" inactive="none">
            <Points x="x" y="y" fill="group" size={6} />
          </Filter>
          <Filter where="@hovered" inactive="none">
            <Points x="x" y="y" size={11} shape="circle-open" fill="#263545" />
            <Text x="x" y="y" text="id" dy={-20} size={12} color="#263545" />
          </Filter>
        </Plot>
      </div>
    </div>
  </div>
</Data>

<style>
  /* The large view and a narrower column of details, 16 px apart; one column once the details
     would be narrower than 270 px, where the two details sit side by side while they fit.
     Python's Row(widths=[1.55, 0.8], wrap=True, min_width=270, gap=16) lays them out the same
     (1.55 / 0.8 = 1.9375, and 270 px times that). */
  .row { display: flex; flex-wrap: wrap; gap: 16px; }
  .main { flex: 1.9375 1 523.125px; min-width: 0; }
  .details { flex: 1 1 270px; min-width: 0; display: flex; flex-wrap: wrap; gap: 14px; }
  .details > div { flex: 1 1 260px; min-width: 0; }
</style>