Data shortcuts
Composable data scopes, coordinate frames, and shared navigation.
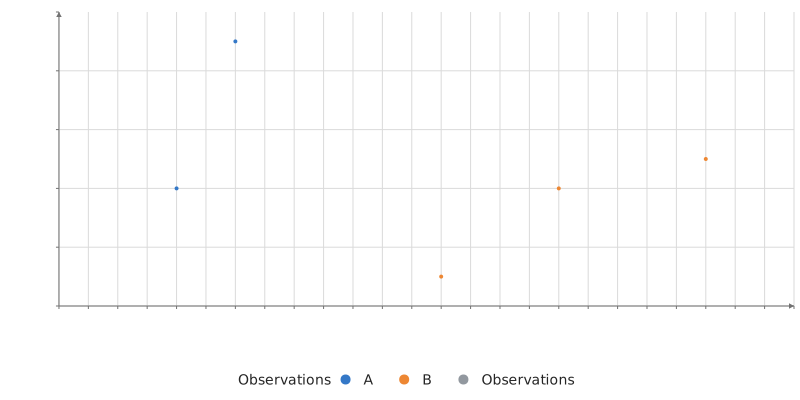
Static preview; loading the interactive plot
<script>
  import { Plot, Points } from "hmplot";

  // Five flowers of two species, measured twice. A Plot's data is a shortcut for a Data scope
  // around its marks: every mark inside reads its columns by name. The legend names the species.
  const flowers = {
    length: [4.9, 5.1, 5.8, 6.2, 6.7],
    width: [3.0, 3.5, 2.7, 3.0, 3.1],
    species: ["A", "A", "B", "B", "B"],
  };
</script>

<Plot data={flowers} height={400} axes2d legend>
  <Points x="length" y="width" fill="species" size={4} label="Observations" />
</Plot>