Shared and independent scales
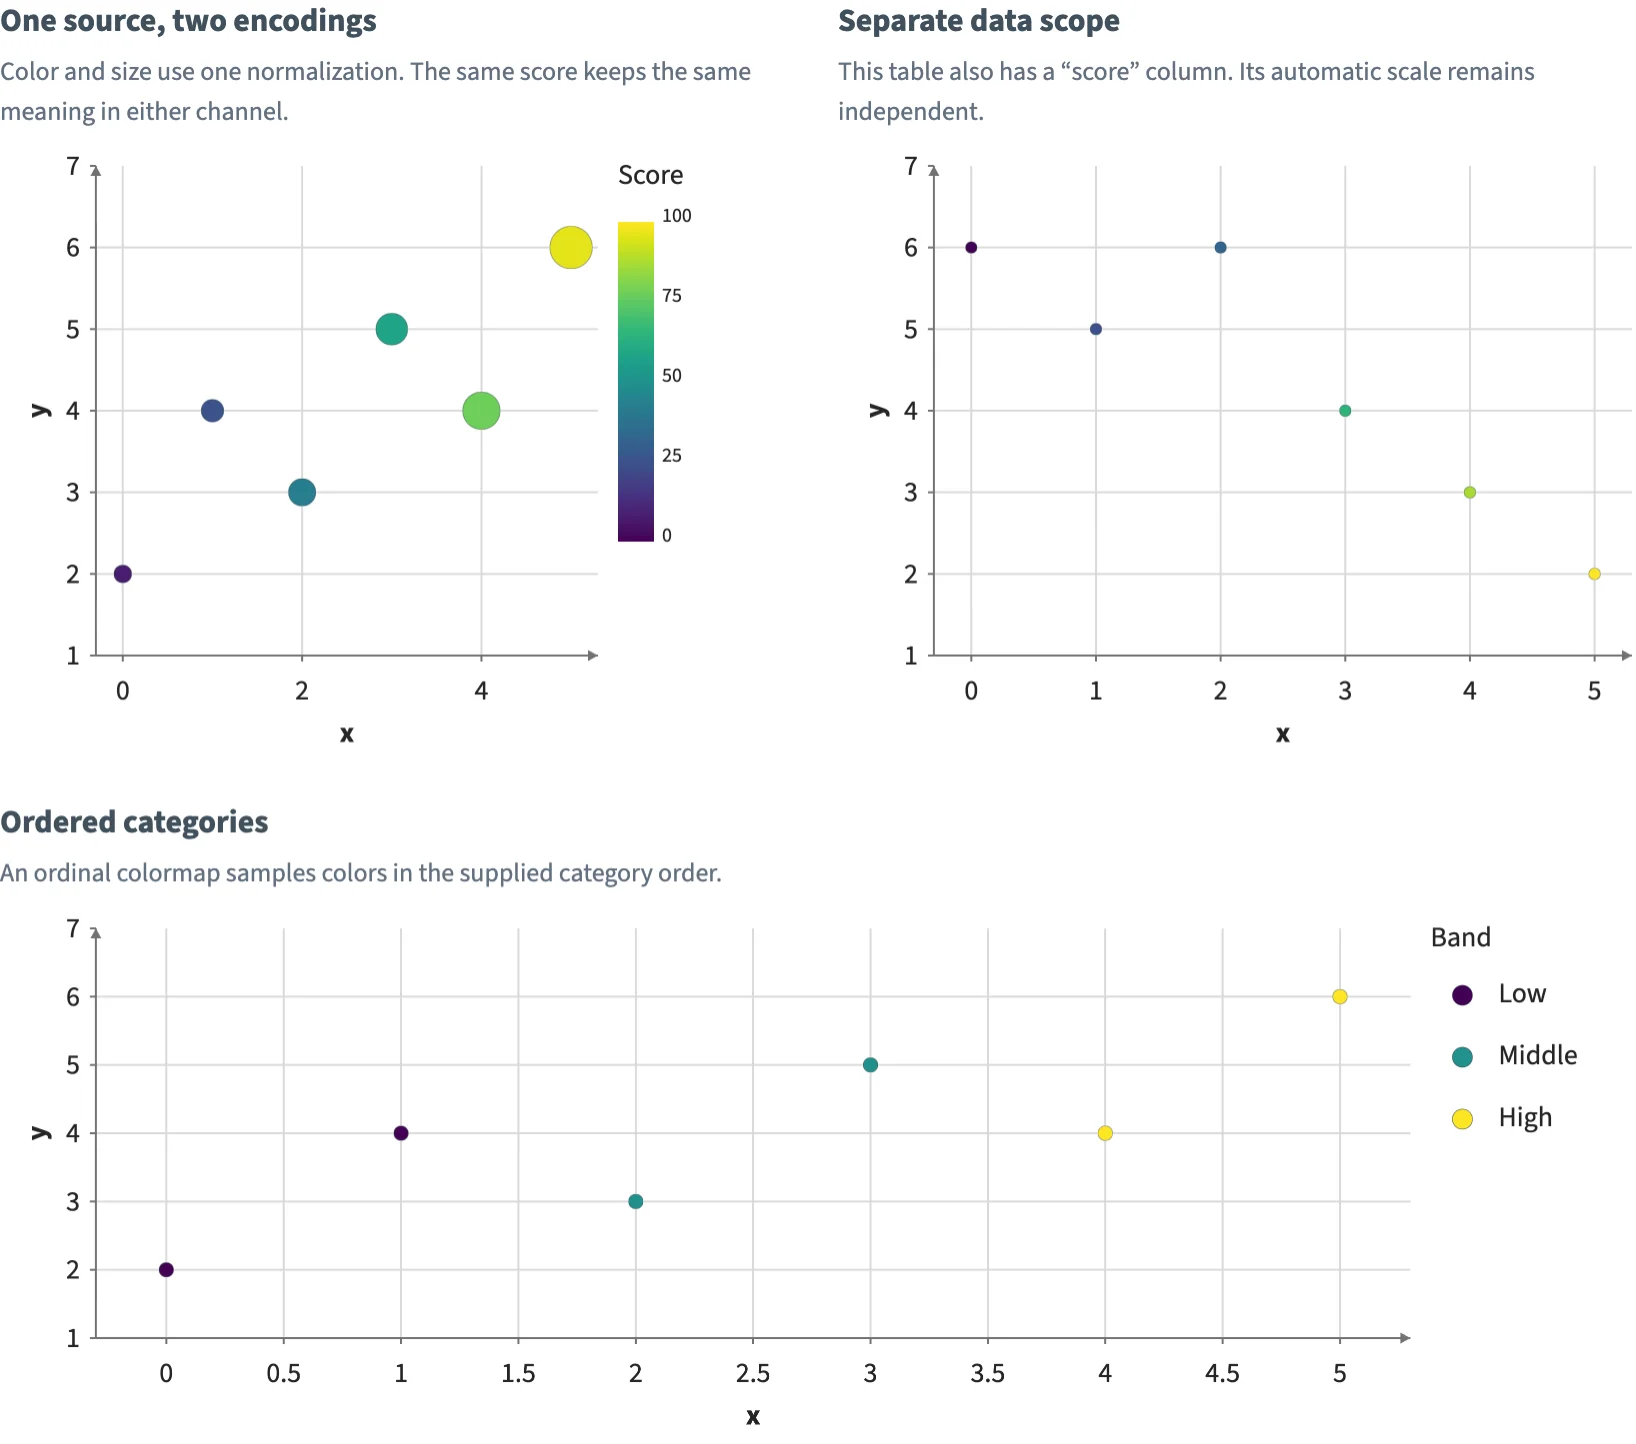
Share one normalization across color and size, isolate same-named columns in separate tables, and map ordered categories.
Static preview; loading the interactive plot
<script>
  import { Plot, Points, Legend, Title, continuous, normalization, ordinal } from "hmplot";

  // Six observations scored from 0 to 100 in three bands, and a second table with a score
  // column of its own.
  const observations = { x: [0, 1, 2, 3, 4, 5], y: [2, 4, 3, 5, 4, 6], score: [8, 25, 42, 58, 78, 96],
    group: ["Low", "Low", "Middle", "Middle", "High", "High"] };
  const comparison = { x: [0, 1, 2, 3, 4, 5], y: [6, 5, 6, 4, 3, 2], score: [20, 35, 40, 60, 74, 82] };
  // One normalization feeds a color scale and a size scale, so a score means the same in both.
  const shared = normalization({ domain: [0, 100] });
  const color = continuous({ normalization: shared, colormap: "Viridis" });
  const size = continuous({ normalization: shared, range: [8, 22] });
  // An ordinal colormap samples its colors in the categories' order.
  const ordered = ordinal({ domain: ["Low", "Middle", "High"], colormap: "Viridis" });
  const bounds = { x: { domain: [-0.3, 5.3] }, y: { domain: [1, 7] } };
  let points = $state(), bands = $state();
</script>

<div class="row">
  <div class="panel">
    <Title text="One source, two encodings" />
    <p>Color and size use one normalization. The same score keeps the same meaning in either channel.</p>
    <Plot data={observations} height={310} axes2d {...bounds}>
      <Points bind:this={points} x="x" y="y" fill="score" size="score" fillScale={color} sizeScale={size}
        outlineColor="#263545" outlineWidth={0.25} />
      <Legend for={points} channel="fill" label="Score" position="right" />
    </Plot>
  </div>
  <div class="panel">
    <Title text="Separate data scope" />
    <p>This table also has a “score” column. Its automatic scale remains independent.</p>
    <Plot data={comparison} height={310} axes2d {...bounds}>
      <Points x="x" y="y" fill="score" size={6} outlineColor="#263545" outlineWidth={0.25} />
    </Plot>
  </div>
  <div class="panel">
    <Title text="Ordered categories" />
    <p>An ordinal colormap samples colors in the supplied category order.</p>
    <Plot data={observations} height={270} axes2d {...bounds}>
      <Points bind:this={bands} x="x" y="y" fill="group" fillScale={ordered} size={7.5}
        outlineColor="#263545" outlineWidth={0.3} />
      <Legend for={bands} channel="fill" label="Band" position="right" />
    </Plot>
  </div>
</div>

<style>
  /* Panels at least 360 px wide, 20 px apart: two to a line at the docs' width, one on a phone.
     Python's Row(wrap=True, min_width=360, gap=20) of Column(gap=6) panels lays them out the same. */
  .row { display: flex; flex-wrap: wrap; gap: 20px; }
  .panel { flex: 1 1 360px; min-width: 0; display: flex; flex-direction: column; gap: 6px; }
  p { margin: 0; color: #627080; line-height: 1.5; }
</style>