Manhattan building flyover
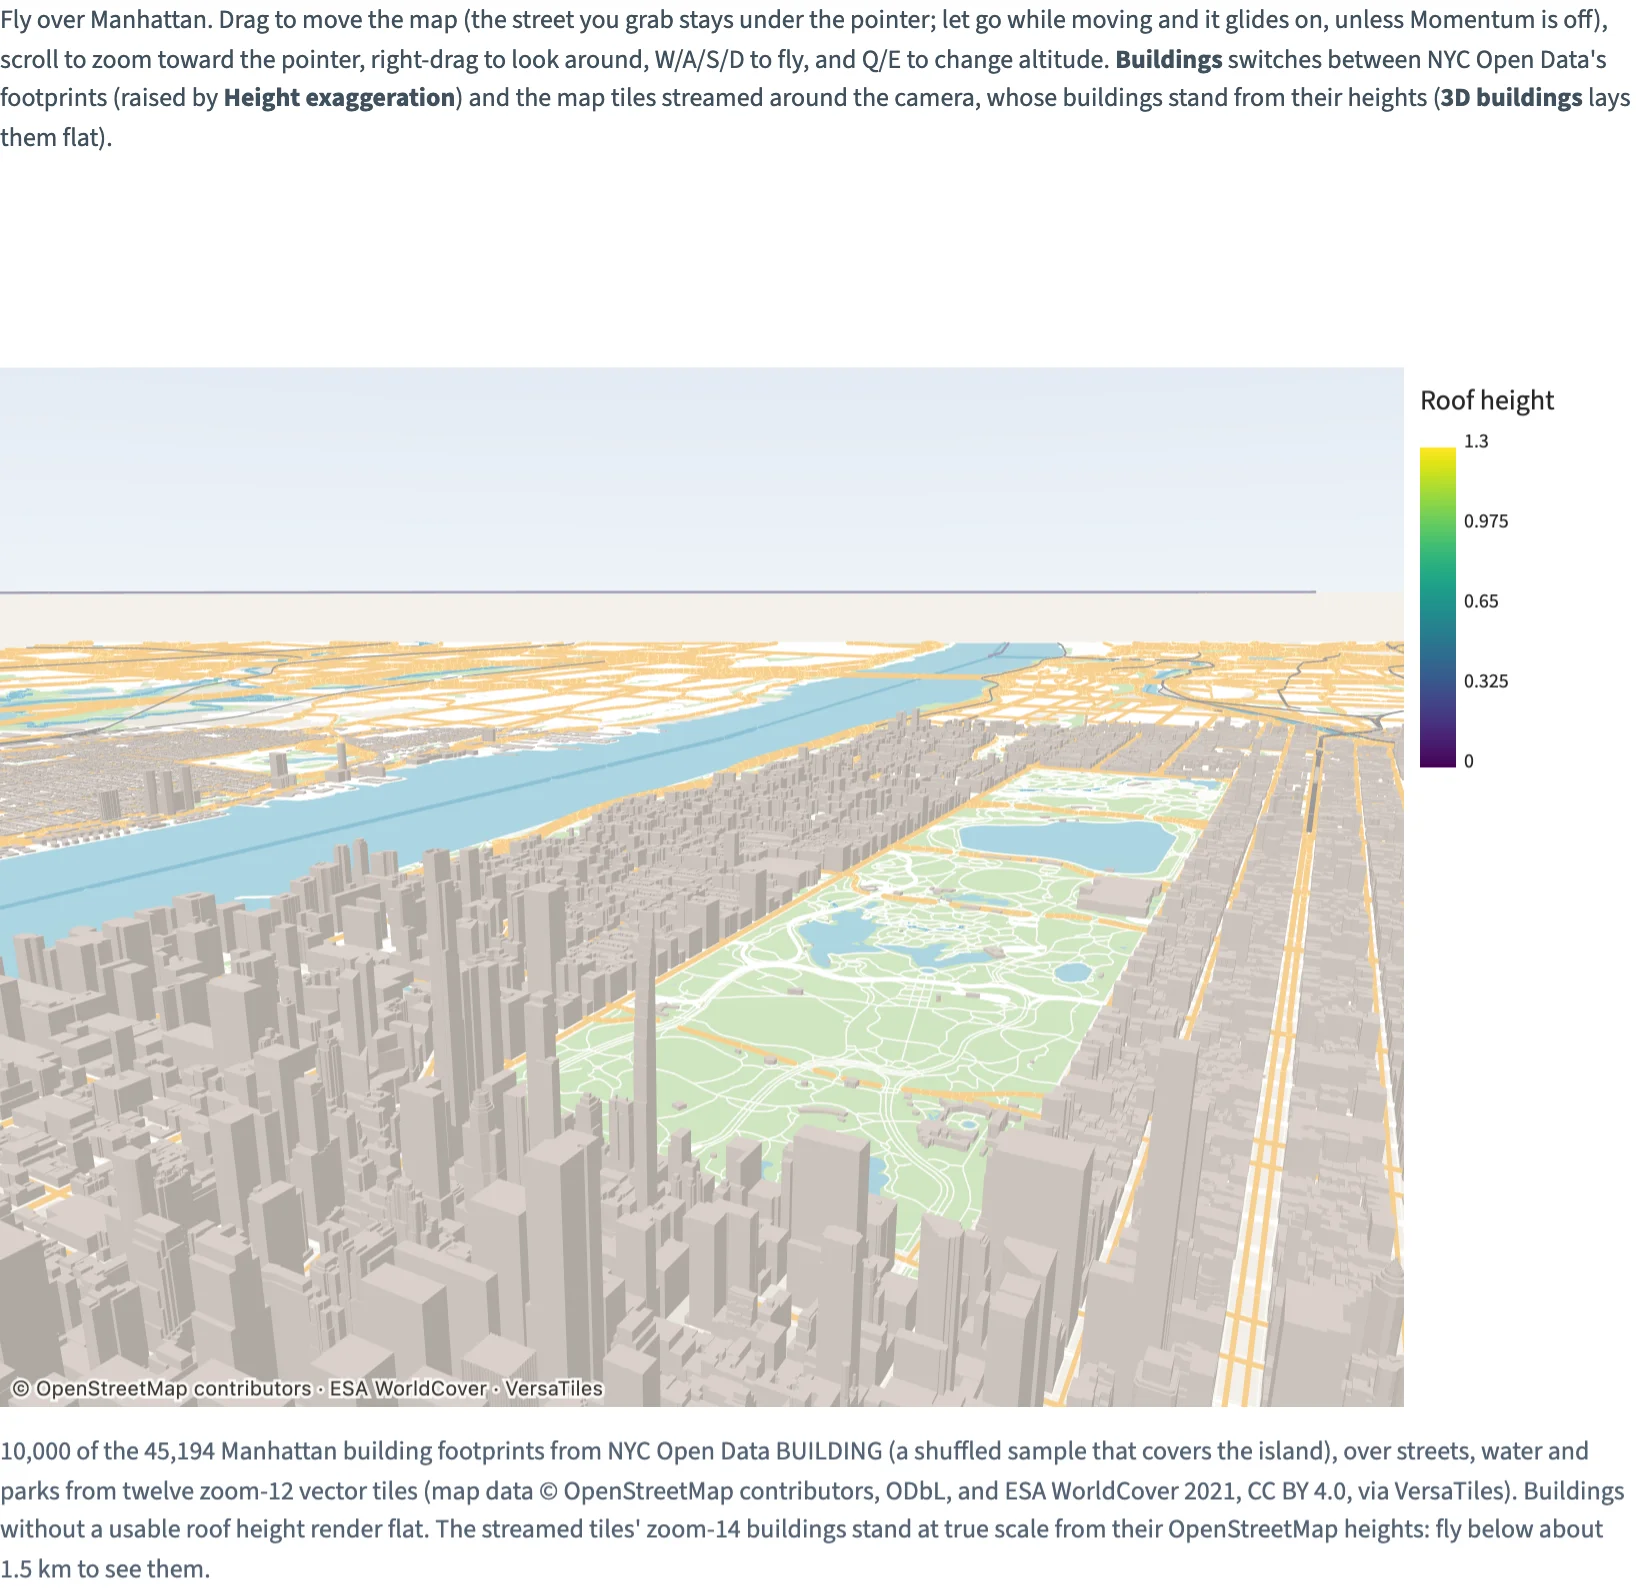
Fly over 10,000 of Manhattan's 45,194 building footprints, over streets, water and parks from vector tiles, or stream the map tiles around the camera with their own buildings standing.
Static preview; loading the interactive plot
Download manhattan-buildings.jsonDownload tile-0-0-0.mvtDownload tile-11-602-769.mvtDownload tile-11-603-769.mvtDownload tile-12-1205-1537.mvtDownload tile-12-1205-1538.mvtDownload tile-12-1205-1539.mvtDownload tile-12-1205-1540.mvtDownload tile-12-1206-1537.mvtDownload tile-12-1206-1538.mvtDownload tile-12-1206-1539.mvtDownload tile-12-1206-1540.mvtDownload tile-12-1207-1537.mvtDownload tile-12-1207-1538.mvtDownload tile-12-1207-1539.mvtDownload tile-12-1207-1540.mvtDownload tile-14-4822-6154.mvtDownload tile-14-4822-6155.mvtDownload tile-14-4822-6156.mvtDownload tile-14-4822-6157.mvtDownload tile-14-4822-6158.mvtDownload tile-14-4822-6159.mvtDownload tile-14-4823-6154.mvtDownload tile-14-4823-6155.mvtDownload tile-14-4823-6156.mvtDownload tile-14-4823-6157.mvtDownload tile-14-4823-6158.mvtDownload tile-14-4823-6159.mvtDownload tile-14-4824-6154.mvtDownload tile-14-4824-6155.mvtDownload tile-14-4824-6156.mvtDownload tile-14-4824-6157.mvtDownload tile-14-4824-6158.mvtDownload tile-14-4824-6159.mvtDownload tile-14-4825-6154.mvtDownload tile-14-4825-6155.mvtDownload tile-14-4825-6156.mvtDownload tile-14-4825-6157.mvtDownload tile-14-4825-6158.mvtDownload tile-14-4825-6159.mvtDownload tile-14-4826-6154.mvtDownload tile-14-4826-6155.mvtDownload tile-14-4826-6156.mvtDownload tile-14-4826-6157.mvtDownload tile-14-4826-6158.mvtDownload tile-14-4826-6159.mvtDownload tile-14-4827-6154.mvtDownload tile-14-4827-6155.mvtDownload tile-14-4827-6156.mvtDownload tile-14-4827-6157.mvtDownload tile-14-4827-6158.mvtDownload tile-14-4827-6159.mvt
<script>
  import { onMount } from "svelte";
  import { InputContext, Select, Slider, Checkbox, Plot, VectorTile, GeoJSON, Legend, continuous } from "hmplot";
  import buildingsFile from "./manhattan-buildings.json?url";

  // Fly over Manhattan: NYC Open Data's building footprints over streets, water and parks from
  // vector tiles, or the map tiles streamed around the camera from VersaTiles with their own
  // buildings standing. Both lie in one local plane: 0.004 scene units per meter around
  // (-73.95, 40.72), the scene's x and z (plane="xz"), with y up.
  const BUILDINGS = 10000; // all in the file: 10,000 of the 45,194, in a shuffled order that covers the island
  // Embedded ground and initial-view tiles (zooms 11, 12 and 14): tile-<z>-<x>-<y>.mvt.
  const tileFiles = import.meta.glob("./tile-*.mvt", { query: "?url", import: "default", eager: true });
  let buildings = $state.raw(), tiles = $state.raw();
  onMount(async () => {
    const all = await (await fetch(buildingsFile)).json();
    buildings = { type: "FeatureCollection", features: all.features.slice(0, BUILDINGS).map((feature) =>
      ({ type: "Feature", geometry: feature.geometry, properties: { height: feature.properties.height } })) };
    tiles = await Promise.all(Object.entries(tileFiles).sort().map(async ([path, url]) => ({
      tile: path.match(/tile-(\d+)-(\d+)-(\d+)/).slice(1).map(Number),
      bytes: new Uint8Array(await (await fetch(url)).arrayBuffer()),
    })));
  });
  // A Plot's camera and fog, and the tiles' and footprints' props, are props of their own: the
  // controls set them through these.
  let source = $state("tiles"), tileDetail = $state(0), exaggeration = $state(10), extrude = $state(true), momentum = $state(true), fog = $state(false);
  const streamed = $derived(source === "tiles");
  // Choosing the streamed tiles flies down over Midtown, where their zoom-14 buildings load; the
  // footprints are seen from above the whole island.
  const cameraPosition = $derived(streamed ? [-9, 3.2, -15] : [90, 70, 140]);
  const cameraTarget = $derived(streamed ? [-9, 0, -27] : [0, 0, 0]);
  let footprints = $state();
</script>

<InputContext>
  <p>Fly over Manhattan. Drag to move the map (the street you grab stays under the pointer; let go while moving and it glides on, unless Momentum is off), scroll to zoom toward the pointer, right-drag to look around, W/A/S/D to fly, and Q/E to change altitude. <strong>Buildings</strong> switches between NYC Open Data's footprints (raised by <strong>Height exaggeration</strong>) and the map tiles streamed around the camera, whose buildings stand from their heights (<strong>3D buildings</strong> lays them flat).</p>
  <div class="controls">
    <Select name="source" label="Buildings" bind:value={source}
      options={{ "NYC Open Data footprints": "nyc", "Map tiles, streamed (VersaTiles)": "tiles" }} />
    <Slider name="exaggeration" label="Height exaggeration" min={1} max={15} step={0.5} format=".1f" bind:value={exaggeration} />
    <Slider name="tileDetail" label="Tile detail" min={-2} max={2} step={0.25} format="+.2f" bind:value={tileDetail} />
    <Checkbox name="extrude" label="3D buildings" bind:value={extrude} />
    <Checkbox name="momentum" label="Momentum" bind:value={momentum} />
    <Checkbox name="fog" label="Fog" bind:value={fog} />
  </div>
  {#if buildings && tiles}
    <!-- A pale sky over the light basemap, seen when the view tilts toward the horizon, and
         distance fog toward it; off, the fog begins far past the city. -->
    <Plot type="3d-y-up" cameraMode="flyover" height={520} flyoverMomentum={momentum} {cameraPosition} {cameraTarget}
      effects={[{ kind: "sky", zenith: "#7fa8d6", horizon: "#eef3f8", ground: "#e4e9ee" },
        { kind: "fog", near: fog ? (streamed ? 6 : 150) : 1e9, far: fog ? (streamed ? 40 : 450) : 2e9, color: "#eef3f8" }]}
      x={{ domain: [-40, 22], range: [-40, 22] }} y={{ domain: [-23, 78], range: [-23, 78] }} z={{ domain: [0, 30], range: [0, 30] }}
      lights={[{ kind: "ambient", intensity: 1.2 }, { kind: "directional", position: [-35, 95, 20], intensity: 2.2 }]}>
      <!-- The ground: the zoom-12 tiles without their buildings; streamed, VersaTiles'
           tiles around the camera at a zoom from its height, their buildings standing. -->
      <VectorTile tileData={tiles} bounds={[-74.068, 40.669, -73.885, 40.895]} zoom={12} origin={[-73.95, 40.72]}
        unitsPerMeter={0.004} plane="xz" live={streamed} zoomBias={tileDetail} extrudeBuildings={streamed && extrude}
        styles={{ places: false, buildings: streamed }} />
      <GeoJSON bind:this={footprints} data={buildings} plane="xz" fill="height" fillScale={continuous({ domain: [0, 1.3] })} height="height"
        heightScale={continuous({ domain: [0, 2], range: [0, 2 * exaggeration] })} outlineColor="#425669" outlineWidth={0} lit
        visible={!streamed} />
      <Legend for={footprints} channel="fill" label="Roof height" position="right" />
    </Plot>
  {/if}
  <p class="credit">10,000 of the 45,194 Manhattan building footprints from NYC Open Data BUILDING (a shuffled sample that covers the island), over streets, water and parks from twelve zoom-12 vector tiles (map data © OpenStreetMap contributors, ODbL, and ESA WorldCover 2021, CC BY 4.0, via VersaTiles). Buildings without a usable roof height render flat. The streamed tiles' zoom-14 buildings stand at true scale from their OpenStreetMap heights: fly below about 1.5 km to see them.</p>
</InputContext>

<style>
  /* Python's Scene(gap=12), Row(wrap=True, min_width=0) and Markdown(font_size=13, color="#536273"). */
  .controls { display: flex; flex-wrap: wrap; align-items: center; gap: 16px; margin: 12px 0; }
  .credit { font-size: 13px; color: #536273; margin-top: 12px; }
</style>