Facets & transforms
Derived data scopes, repeated plots, and extruded bins.
Static preview; loading the interactive plot
<script>
  import { InputContext, Slider, Select, Data, Facet, Plot, Points, Rect, Prism, Title, input, continuous } from "hmplot";
import { Bin, Hexbin, Normalize } from "hmplot/stats";

  // One table of 120 observations in three groups at two sites, shown as small multiples and
  // through the transforms around them: a Facet repeats one Plot per cell; a transform above the
  // Facet (Normalize) sees every row, one inside it (Bin) only its cell's.
  const observations = Array.from({ length: 120 }, (_, i) => ({
    x: Math.sin(i * 1.71) * 2 + (i % 3),
    y: Math.cos(i * 0.71) * 2,
    z: Math.sin(i * 0.31) * 2,
    group: ["A", "B", "C"][i % 3],
    site: i % 2 === 1 ? "North" : "South",
  }));
  // A Plot's type is a prop of its own: the View select sets it through `view`.
  let view = $state("3d");
</script>

<InputContext>
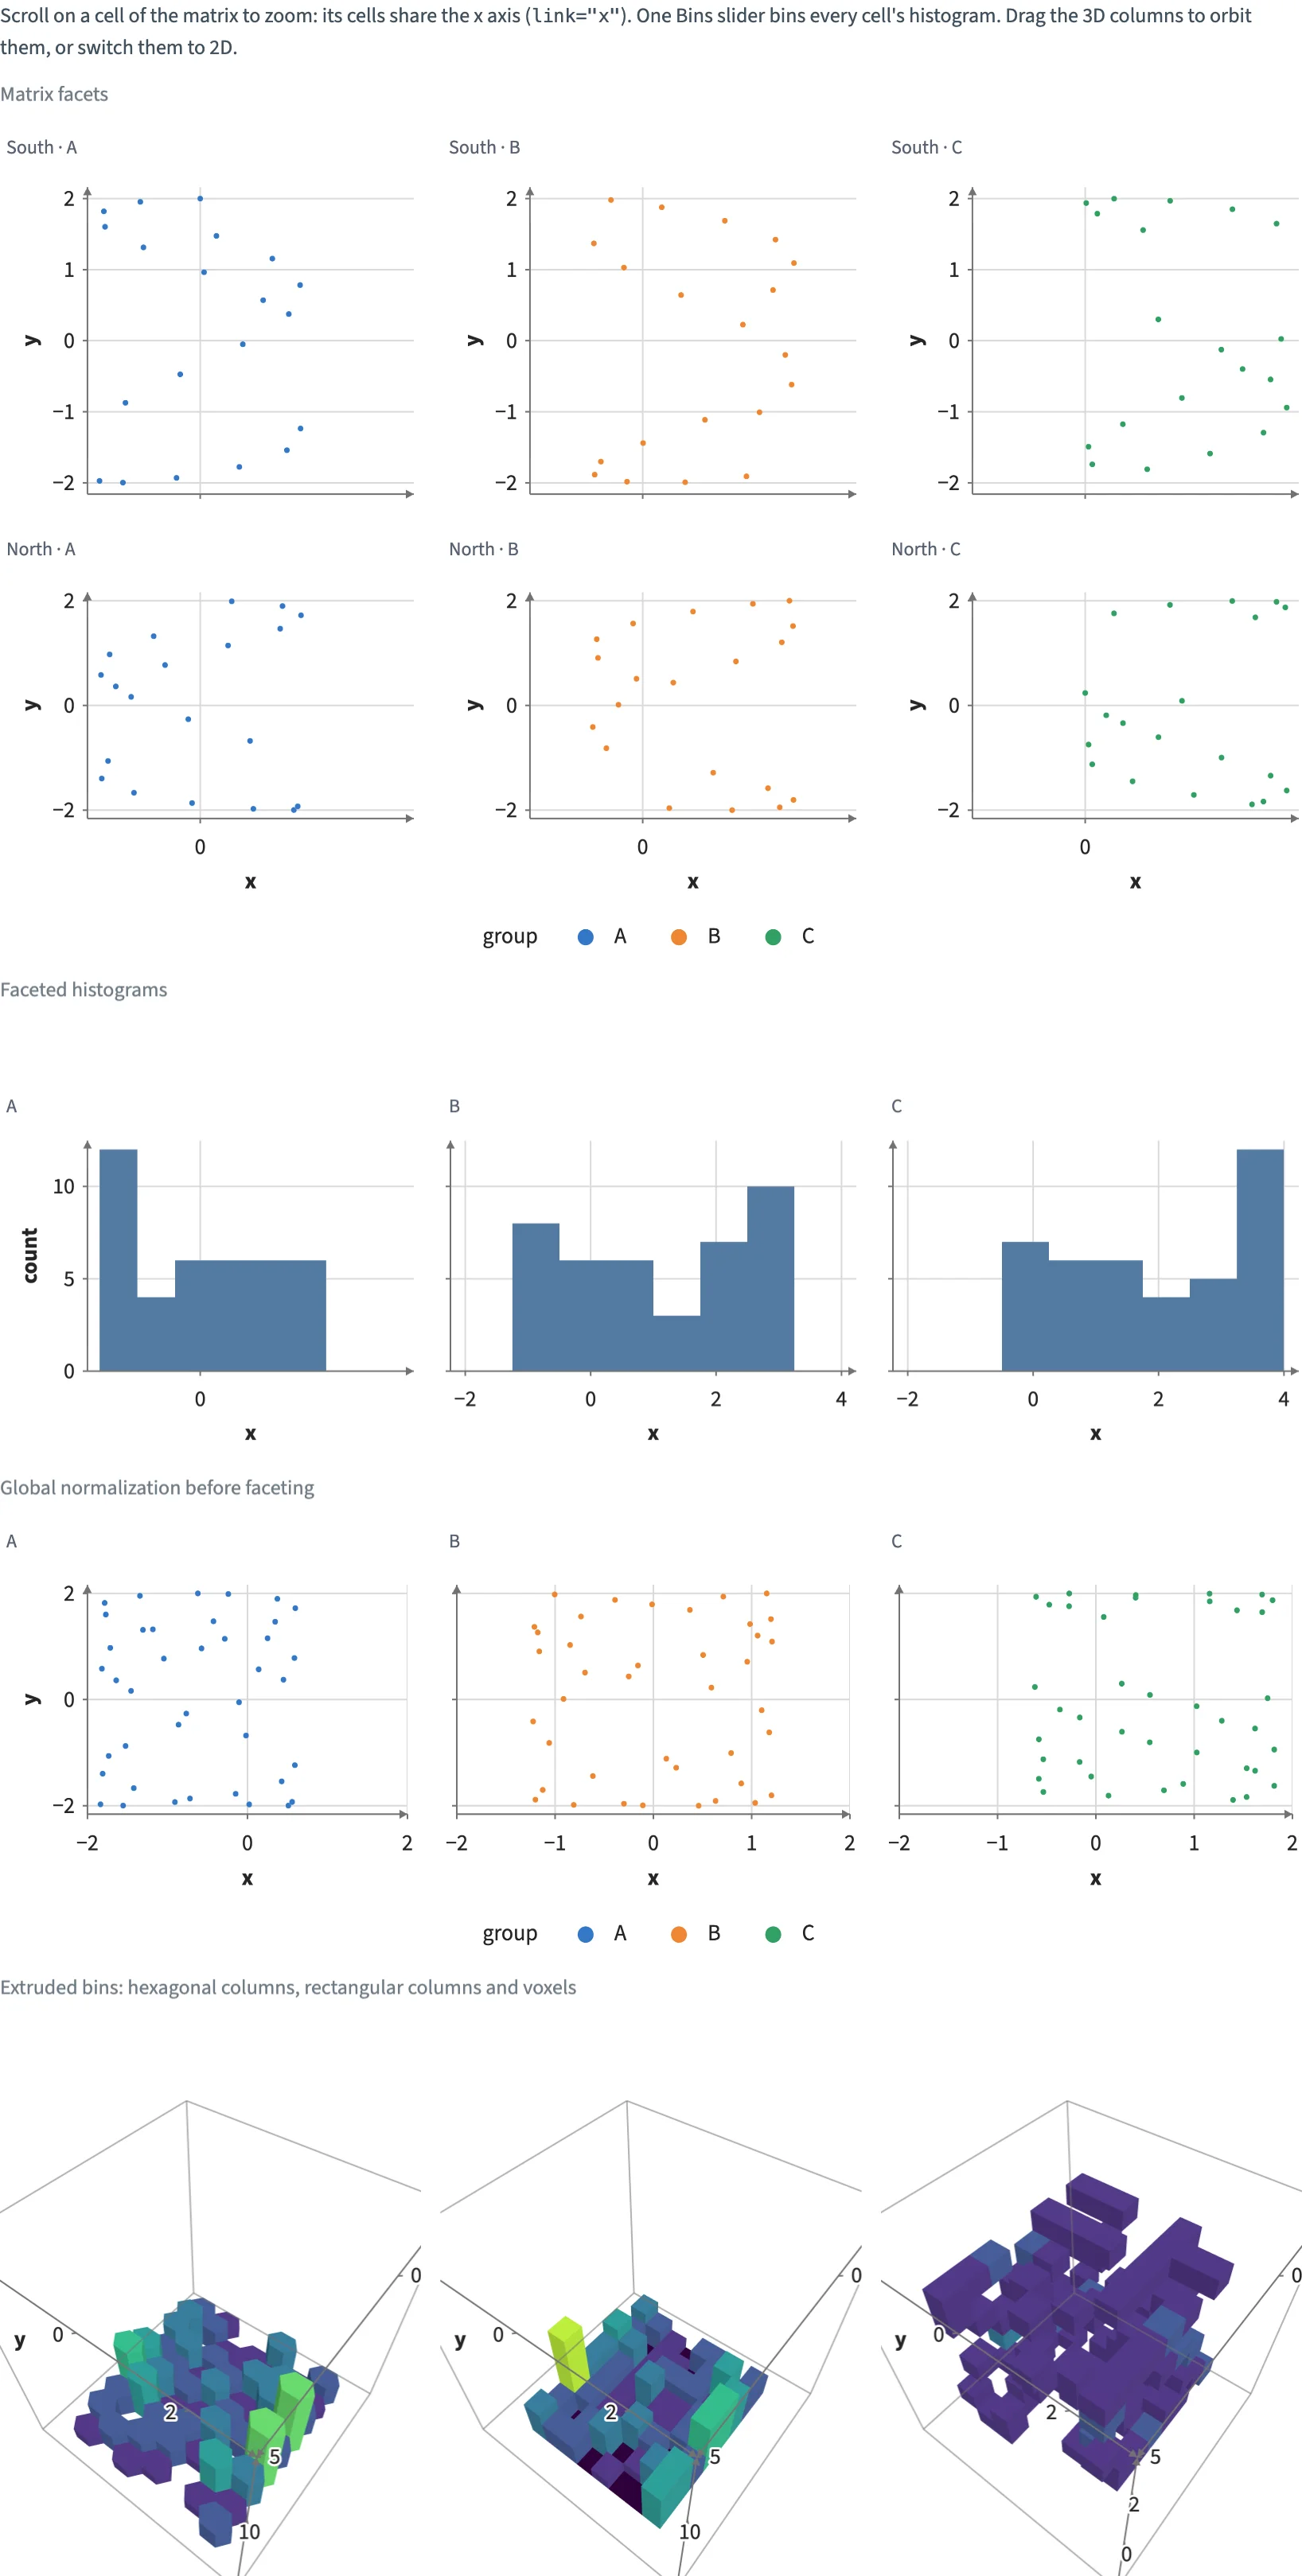
  <p>Scroll on a cell of the matrix to zoom: its cells share the x axis (<code>link="x"</code>). One Bins slider bins every cell's histogram. Drag the 3D columns to orbit them, or switch them to 2D.</p>
  <Data value={observations}>
    <Title text="Matrix facets" size="subtitle" />
    <Facet row="site" column="group" link="x">
      <Plot height={200} axes2d>
        <Points x="x" y="y" fill="group" size={3.5} />
      </Plot>
    </Facet>
    <Title text="Faceted histograms" size="subtitle" />
    <Slider name="bins" label="Bins" min={1} max={64} step={1} value={8} />
    <Facet column="group" wrap={3}>
      <Plot height={200} axes2d>
        <Bin x="x" bins={input.bins}>
          <Rect x0="x0" x1="x1" y0={0} y1="count" fill="#547ba2" />
        </Bin>
      </Plot>
    </Facet>
    <Title text="Global normalization before faceting" size="subtitle" />
    <Normalize field="x" as="x">
      <Facet column="group" wrap={3}>
        <Plot height={200} axes2d>
          <Points x="x" y="y" fill="group" size={3.5} />
        </Plot>
      </Facet>
    </Normalize>
    <Title text="Extruded bins: hexagonal columns, rectangular columns and voxels" size="subtitle" />
    <div class="controls">
      <Select name="view" label="View" options={["3d", "2d"]} bind:value={view} />
      <Slider name="columns" label="Columns" min={1} max={20} step={1} value={8} />
    </div>
    <div class="row">
      <Plot type={view} height={300} axes3d x={{ domain: [-3, 5] }} y={{ domain: [-3, 3] }} z={{ domain: [0, 15] }}
      lights={[{ kind: "ambient", intensity: 1.5 }, { kind: "directional", position: [40, 80, 100], intensity: 3 }]}>
        <Hexbin x="x" y="y" bins={input.columns}>
          <Prism x="x" y="y" width="width" depth="depth" z0={0} z1="count" shape="hexagon"
            rotation="rotation" fill="count" fillScale={continuous({ domain: [0, 8] })} lit />
        </Hexbin>
      </Plot>
      <Plot type={view} height={300} axes3d x={{ domain: [-3, 5] }} y={{ domain: [-3, 3] }} z={{ domain: [0, 15] }}
      lights={[{ kind: "ambient", intensity: 1.5 }, { kind: "directional", position: [40, 80, 100], intensity: 3 }]}>
        <Bin x="x" y="y" bins={input.columns}>
          <Rect x0="x0" x1="x1" y0="y0" y1="y1" z0={0} z1="count" fill="count" fillScale={continuous({ domain: [0, 8] })} lit />
        </Bin>
      </Plot>
      <Plot type={view} height={300} axes3d x={{ domain: [-3, 5] }} y={{ domain: [-3, 3] }} z={{ domain: [-3, 3] }}
      lights={[{ kind: "ambient", intensity: 1.5 }, { kind: "directional", position: [40, 80, 100], intensity: 3 }]}>
        <Bin x="x" y="y" z="z" bins={input.columns} empty={false}>
          <Rect x0="x0" x1="x1" y0="y0" y1="y1" z0="z0" z1="z1" fill="count" fillScale={continuous({ domain: [0, 8] })} lit />
        </Bin>
      </Plot>
    </div>
  </Data>
</InputContext>

<style>
  /* Python's Scene(gap=12), Row(wrap=True, min_width=0) and Row(wrap=True, min_width=250, gap=12). */
  .controls { display: flex; flex-wrap: wrap; align-items: center; gap: 16px; margin: 12px 0; }
  .row { display: flex; flex-wrap: wrap; gap: 12px; }
  .row > :global(*) { flex: 1 1 250px; min-width: 0; }
</style>