Theme presets
Compare every built-in theme on the same plot, including backgrounds, axes, marks, categorical colors, and its legend.
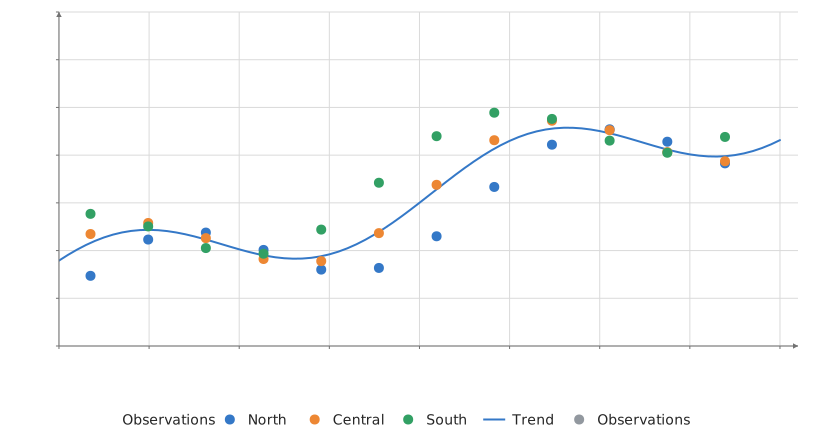
Static preview; loading the interactive plot
<script>
  import { InputContext, Select, Theme, Plot, Line, Points, themes } from "hmplot";

  // Three series of twelve observations and a trend line, drawn in any of the 32 built-in theme
  // presets: the theme sets the background, axes, text, mark defaults, the categorical palette
  // and the legend.
  const observations = Array.from({ length: 36 }, (_, i) => {
    const x = 0.35 + (i % 12) * 0.64, series = Math.floor(i / 12);
    return { x, y: 0.45 + 0.23 * x + 0.45 * Math.sin(x * 1.35 + series * 0.75) + series * 0.22,
      group: ["North", "Central", "South"][series] };
  });
  const trend = Array.from({ length: 81 }, (_, i) => [i * 0.1, 0.65 + 0.23 * i * 0.1 + 0.38 * Math.sin(i * 0.1 * 1.35 + 0.7)]);

  // Every preset by its display name. The Theme extends the chosen one: a Theme's value is a prop
  // of its own, so the select sets it through `theme`.
  const presets = Object.fromEntries(Object.entries(themes).map(([name, preset]) => [preset.name, name]));
  let theme = $state("hmplot");
</script>

<InputContext>
  <div class="scene">
    <div class="controls">
      <Select name="theme" label="Theme preset" options={presets} bind:value={theme} />
    </div>
    <Theme value={{ extends: theme }}>
      <Plot data={observations} height={440} axes2d legend x={{ domain: [0, 8.2], label: "Time" }}
        y={{ domain: [0, 3.5], label: "Value" }}>
        <Line position={trend} label="Trend" />
        <Points x="x" y="y" fill="group" label="Observations" />
      </Plot>
    </Theme>
  </div>
</InputContext>

<style>
  /* Python's Scene(gap=12) and Row(wrap=True, min_width=0). */
  .scene { display: flex; flex-direction: column; gap: 12px; }
  .controls { display: flex; flex-wrap: wrap; align-items: center; gap: 16px; }
</style>