Calculated scatterplot matrix
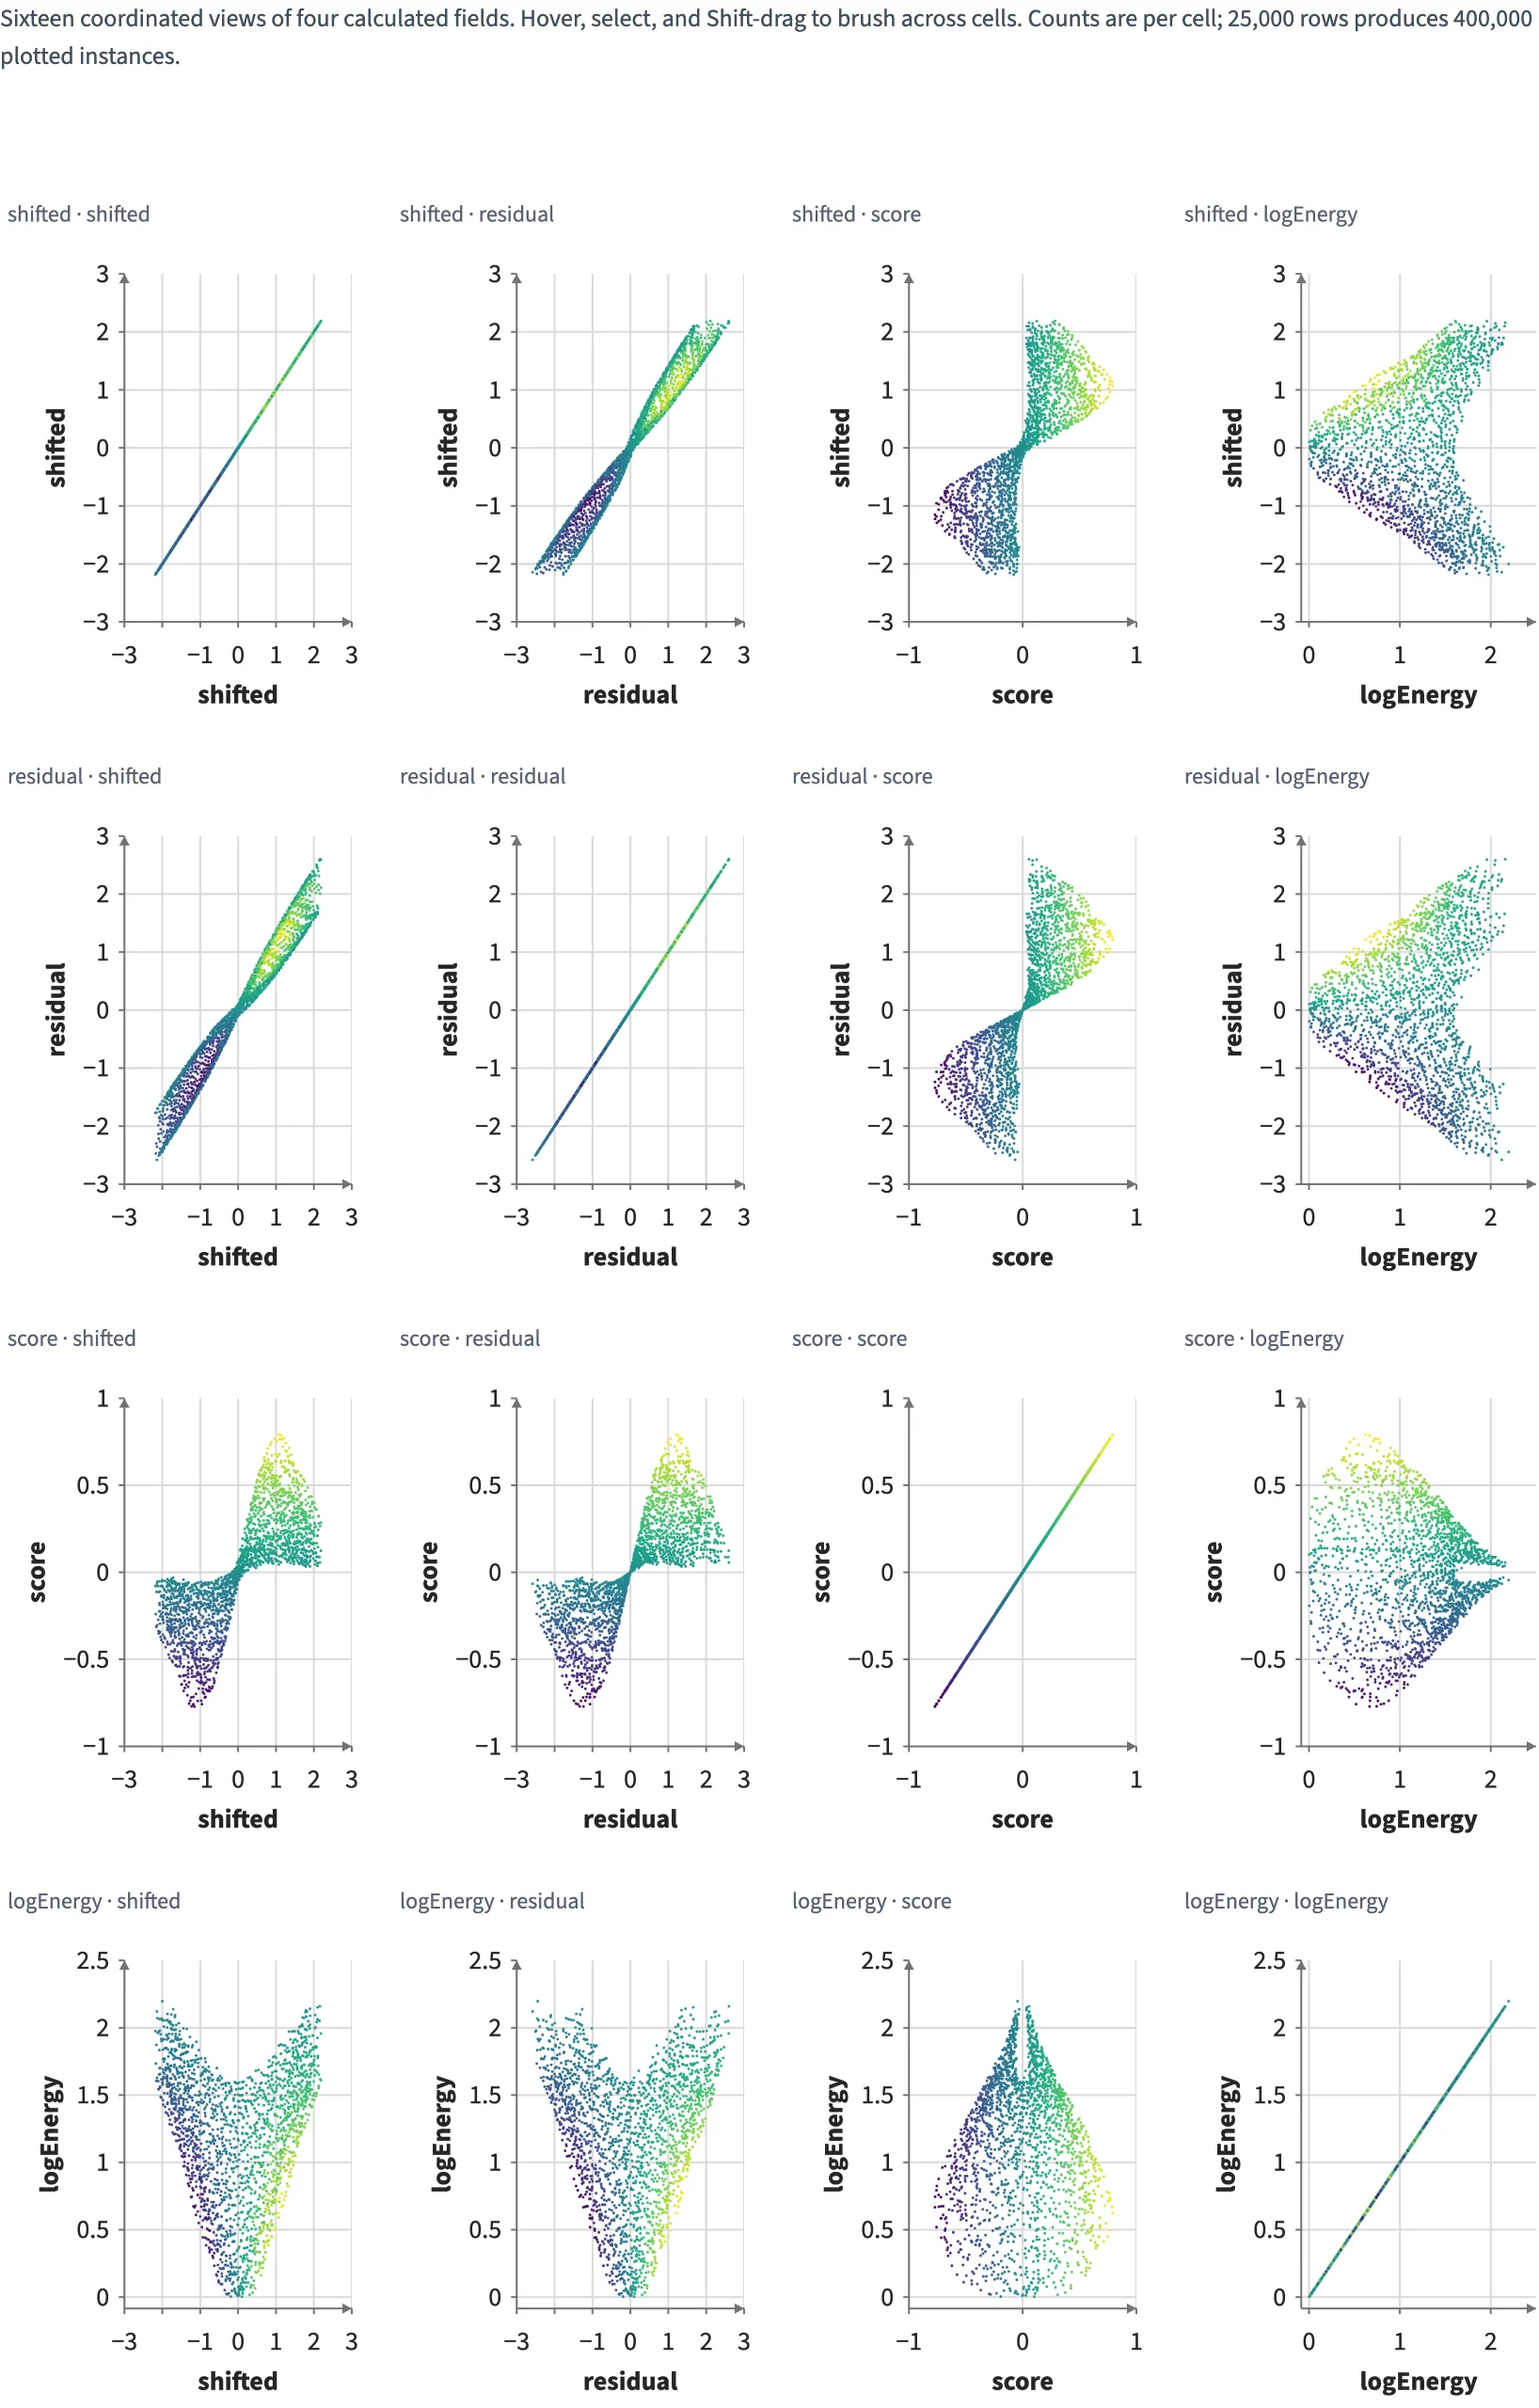
Sixteen coordinated views of four calculated fields. Hover, select, and Shift-drag to brush across cells. Counts are per cell; 25,000 rows produces 400,000 plotted instances.
Static preview; loading the interactive plot
<script>
  import { InputContext, Select, Slider, Data, Filter, Calculate, Facet, Plot, Points, input, col, less, add,
    subtract, multiply, divide, square, sqrt, log, exp, clip, where } from "hmplot";

  // 25,000 points spread evenly over [-2, 2] x [-2, 2], with a little noise. Rows shows the first
  // 2,000, 10,000 or all of them; Gain scales the last of three Calculate stages.
  const count = 25000;
  const data = { row: new Float32Array(count), x: new Float32Array(count), y: new Float32Array(count), noise: new Float32Array(count) };
  for (let i = 0; i < count; i++) {
    data.row[i] = i;
    data.x[i] = 4 * ((i * 7919 % 104729) / 104729) - 2;
    data.y[i] = 4 * ((i * 1543 % 104723) / 104723) - 2;
    data.noise[i] = Math.sin(i * 0.73) * 0.2;
  }
</script>

<InputContext>
  <p>Sixteen coordinated views of four calculated fields. Hover, select, and Shift-drag to brush across cells. Counts are per cell; 25,000 rows produces 400,000 plotted instances.</p>
  <div class="controls">
    <Select name="rows" label="Rows" options={{ "2,000": 2000, "10,000": 10000, "25,000": 25000 }} />
    <Slider name="gain" label="Gain" min={0.25} max={2} step={0.25} value={1} />
  </div>
  <Data value={data}>
    <Filter where={less(col.row, input.rows)}>
      <!-- Calculate assignments are simultaneous; nest scopes for dependencies. -->
      <Calculate columns={{ energy: add(square("x"), square("y")), cross: multiply("x", "y"), shifted: add("x", "noise") }}>
        <Calculate columns={{ weight: exp(multiply("energy", -0.5)), logEnergy: log(add("energy", 1)),
          residual: subtract("shifted", divide("cross", add("energy", 1))) }}>
          <Calculate columns={{ score: clip(multiply(multiply("residual", "weight"), input.gain), -2, 2),
            magnitude: sqrt(add(square("residual"), 0.01)) }}>
            <Facet pairs={["shifted", "residual", "score", "logEnergy"]} scales="field" link="grid" cacheSize={64}>
              <Plot height={250} axes2d>
                <Points x="x" y="y" fill="score" size={where("@hovered", 8, 1.5)}
                  hover select brush respond={["hovered", "selected", "brushed"]} />
              </Plot>
            </Facet>
          </Calculate>
        </Calculate>
      </Calculate>
    </Filter>
  </Data>
</InputContext>

<style>
  /* Python's Scene(gap=12) and Row(wrap=True, min_width=0, gap=20). */
  .controls { display: flex; flex-wrap: wrap; align-items: center; gap: 20px; margin: 12px 0; }
</style>