Signal and uncertainty
Animated intervals, estimates, observations, error bars, legends, and an independent overview.
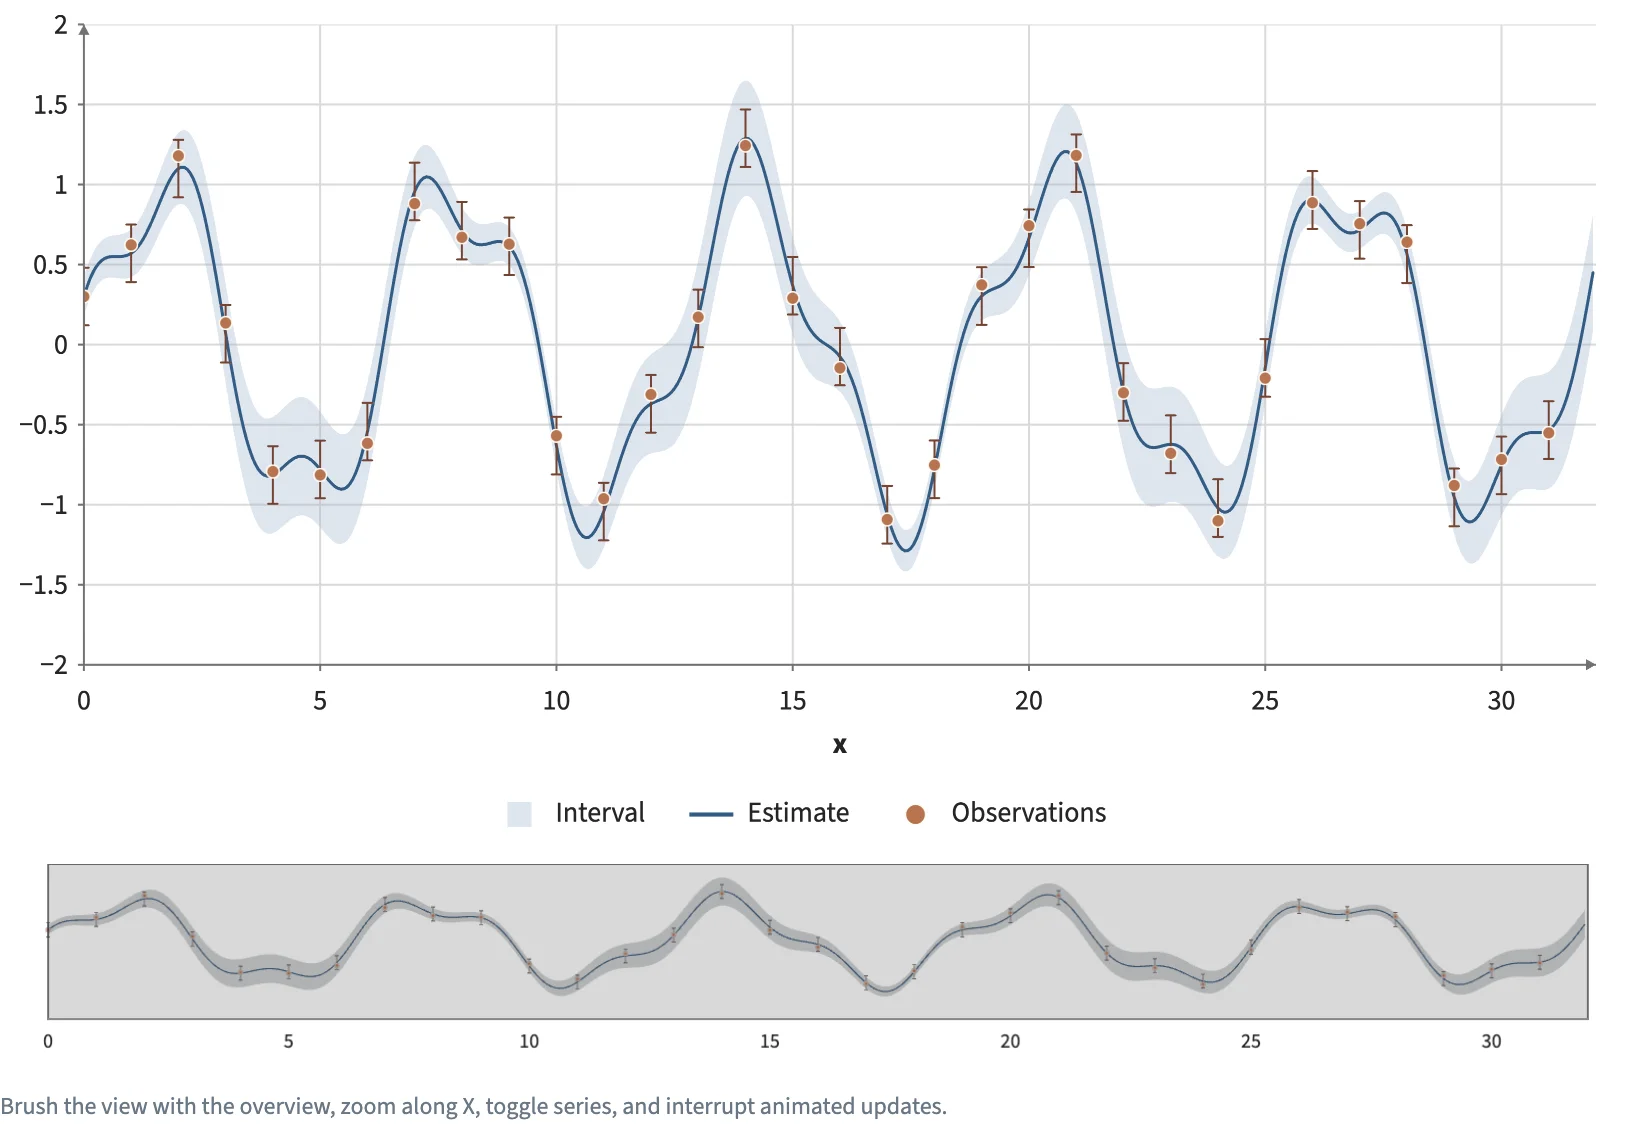
Static preview; loading the interactive plot
<script>
  import { InputContext, Button, Checkbox, Plot, Data, Calculate, Area, Line, Points, Minimap, input, col, add, subtract, multiply, sin, cos } from "hmplot";
import { ErrorBars } from "hmplot/charts";

  // A signal and its uncertainty: 512 estimates with a band that widens and narrows, and 32
  // noisy observations with error bars. "New target" moves the signal's phase on by 0.8 (a
  // Button counts its presses, and Calculate reads the count on the GPU); the plot animates each
  // change over 700 ms while "Animate" is on.
  const estimates = Array.from({ length: 512 }, (_, i) => ({ x: i / 16, band: 0.12 + 0.25 * Math.sin((i / 16) * 0.35) ** 2 }));
  const observations = Array.from({ length: 32 }, (_, k) => ({ x: k, noise: 0.08 * Math.sin(k * 7) }));

  const phase = multiply(0.8, input.target);
  const signal = add(sin(add(col.x, phase)), multiply(0.3, cos(subtract(multiply(col.x, 2.7), phase))));
  // A Plot's animation is a prop of its own: the Animate checkbox sets it through `animate`.
  let animate = $state(true), plot = $state();
</script>

<InputContext>
  <div class="scene">
    <div class="controls">
      <Button name="target" label="New target" />
      <Checkbox name="animate" label="Animate" bind:value={animate} />
    </div>
    <Plot bind:this={plot} x={{ domain: [0, 32] }} y={{ domain: [-2, 2] }} height={420} axes2d zoomAxis="x" legend
      animation={animate} animationDuration={700}>
      <Data value={estimates}>
        <Calculate columns={{ y: signal, lower: subtract(signal, col.band), upper: add(signal, col.band) }}>
          <Area opacity={0.2} x="x" lower="lower" upper="upper" fill="#577eac" label="Interval" />
          <Line x="x" y="y" width={1.5} color="#325b83" label="Estimate" />
        </Calculate>
      </Data>
      <Data value={observations}>
        <Calculate columns={{ y: add(signal, col.noise), lower: subtract(signal, 0.18), upper: add(signal, 0.18) }}>
          <ErrorBars x="x" y="y" lower="lower" upper="upper" color="#754331" capSize={5} />
          <Points x="x" y="y" fill="#b77450" size={7} outlineColor="#fffaf0"
            outlineWidth={0.7} label="Observations" />
        </Calculate>
      </Data>
    </Plot>
    <!-- As wide as the docs' column (narrower screens shrink it): drag its window to move the view. -->
    <Minimap for={plot} width={818} height={100} axes={{ x: true, y: false }} />
    <p>Brush the view with the overview, zoom along X, toggle series, and interrupt animated updates.</p>
  </div>
</InputContext>

<style>
  /* Python's Scene(gap=12) and Row(wrap=True, min_width=0). */
  .scene { display: flex; flex-direction: column; gap: 12px; }
  .controls { display: flex; flex-wrap: wrap; align-items: center; gap: 16px; }
  p { margin: 0; font-size: 12px; color: #697785; }
</style>