Ten million stars, filtered live
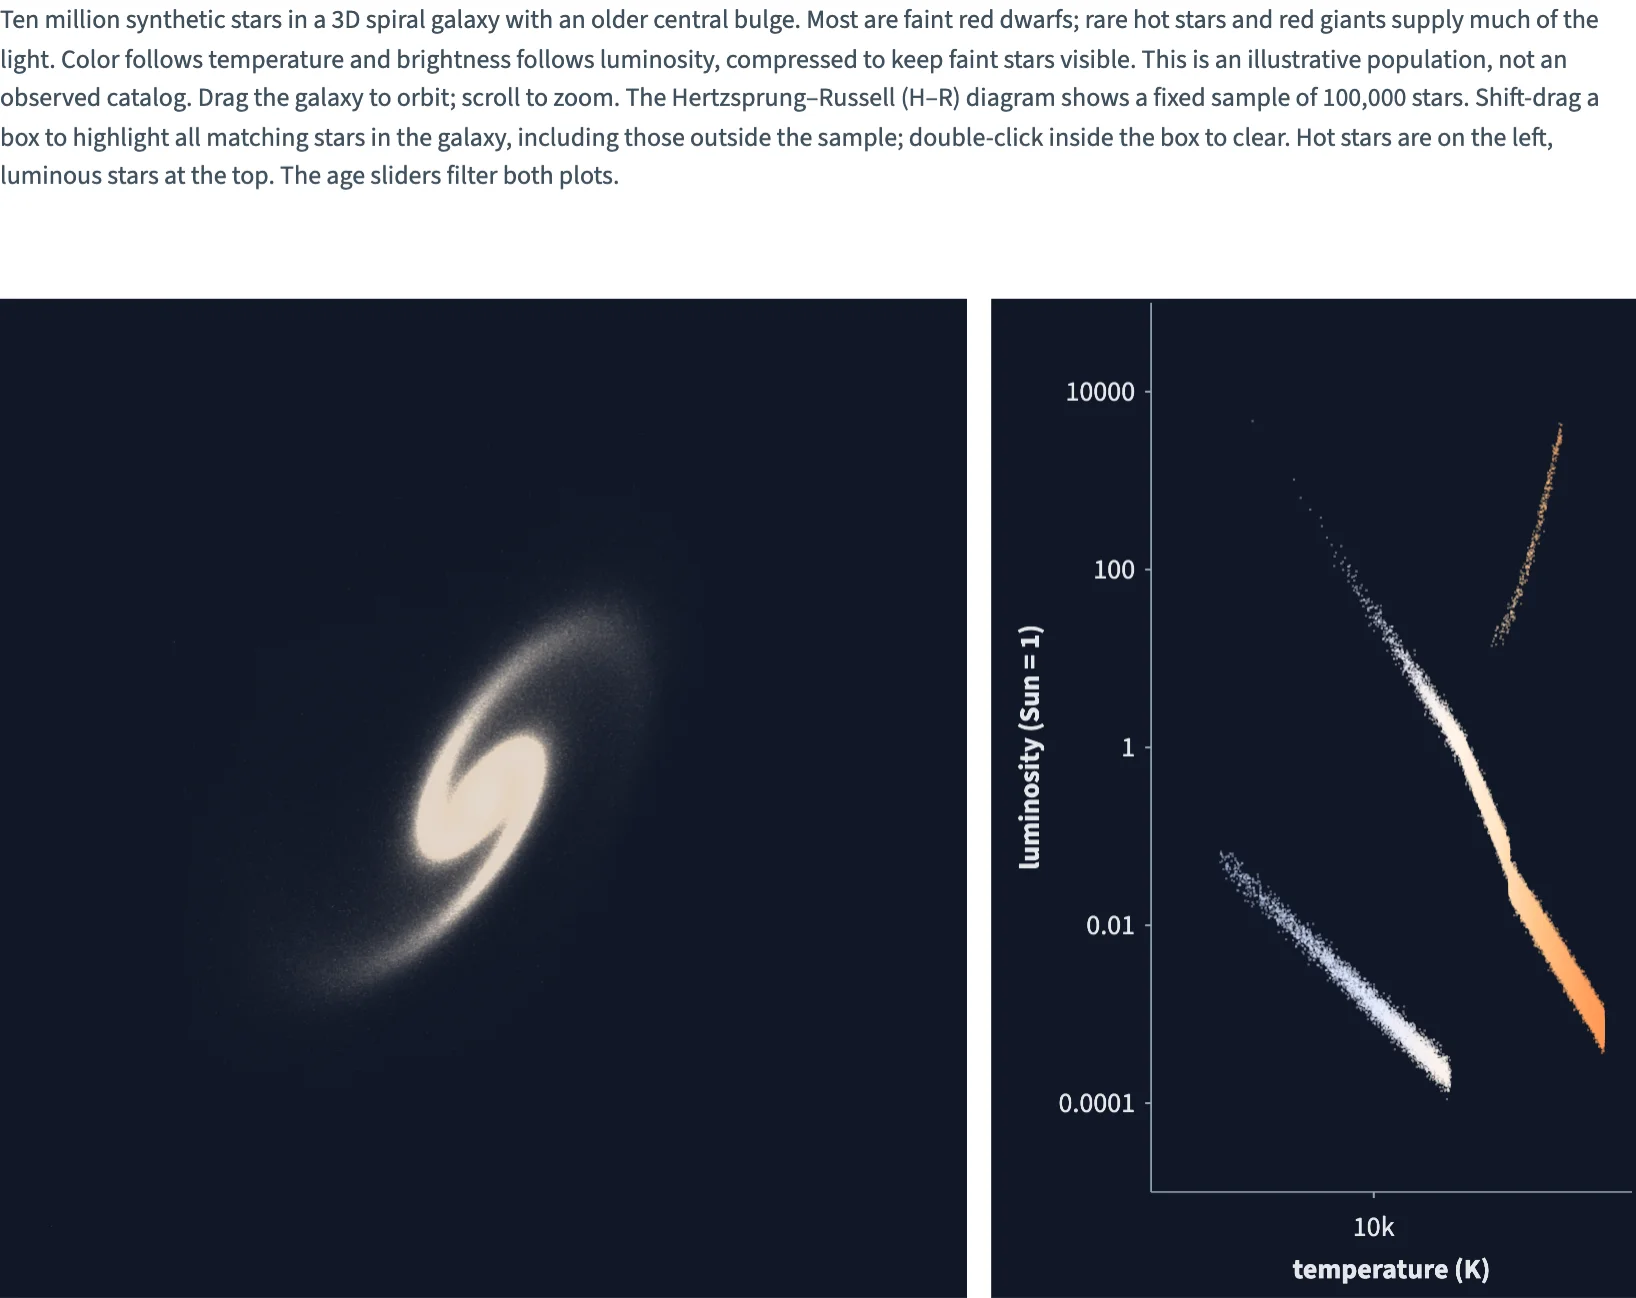
Ten million synthetic stars generated by Data(rows) on the GPU, age-filtered live, with a fixed 100,000-star H–R sample that brushes the whole galaxy. Square points and additive starlight.
Static preview; loading the interactive plot
<script>
  import { untrack, onMount } from "svelte";
  import { InputContext, Slider, Theme, themes, Data, Calculate, Filter, Sample, Plot, Points, continuous,
    col, input, random, logical_and, greater_equal, less_equal, multiply, add, subtract, divide, where, less, greater,
    power, square, sqrt, minimum, maximum, clip, floor, exp, log, sin, cos } from "hmplot";
  import { galaxyColumns, galaxyIntensity } from "./galaxy.js";
  let { onready = () => {} } = $props();
  let plot = $state(), hr = $state();
  $effect(() => { if (plot) untrack(() => onready(plot)); });

  const STARS = 10_000_000;
  const columns = galaxyColumns({ random, multiply, add, subtract, divide, where, less, greater,
    greater_equal, power, square, sqrt, minimum, maximum, clip, floor, exp, log, sin, cos });
  const intensity = galaxyIntensity({ where, greater, clip, multiply, power });
  // Approximate blackbody colors, shared by both views; sunlight is warm white.
  const temperatures = continuous({ domain: [2400, 40000], colormap: {
    colors: ["#ff9955", "#ffc184", "#ffe4c4", "#fff4ea", "#e4ebff", "#a9c5ff"],
    positions: [0, 0.029, 0.0585, 0.096, 0.202, 1], space: "srgb",
  } });
  const kept = logical_and(greater_equal(col("age"), input("youngest")), less_equal(col("age"), input("oldest")));
  onMount(() => {
    if (import.meta.env.DEV) window.__galaxyExample = { get plot() { return plot; }, get hr() { return hr; } };
    return () => { if (import.meta.env.DEV) delete window.__galaxyExample; };
  });
</script>

<InputContext>
<div class="scene">
  <p>Ten million synthetic stars in a 3D spiral galaxy with an older central bulge. Most are faint red dwarfs; rare hot stars and red giants supply much of the light. Color follows temperature and brightness follows luminosity, compressed to keep faint stars visible. This is an illustrative population, not an observed catalog. Drag the galaxy to orbit; scroll to zoom. The Hertzsprung–Russell (H–R) diagram shows a fixed sample of 100,000 stars. Shift-drag a box to highlight all matching stars in the galaxy, including those outside the sample; double-click inside the box to clear. Hot stars are on the left, luminous stars at the top. The age sliders filter both plots.</p>
  <div class="controls">
    <Slider name="youngest" label="Youngest (billion years)" min={0} max={10} step={0.05} value={0} />
    <Slider name="oldest" label="Oldest (billion years)" min={0} max={10} step={0.05} value={10} />
  </div>
    <Theme value={themes.dark}>
      <Data rows={STARS}>
        <Calculate {columns}>
        <Calculate columns={{ intensity }}>
        <div class="row">
          <div class="main">
            <Filter where={kept}>
              <Plot bind:this={plot} type="3d" height={500} antialias="off" toneMapping={4} cameraPosition={[105, 95, 165]}
                x={{ domain: [-10, 10] }} y={{ domain: [-10, 10] }} z={{ domain: [-10, 10] }}>
                <Points x="x" y="y" z="z" fill="temperature" fillScale={temperatures} shape="square"
                  size={0.7} opacity="intensity" blend="additive" respond="brushed" selectionOpacity={0.015} legend={false} />
              </Plot>
            </Filter>
          </div>
          <div class="side">
            <!-- Sample the source once; age changes filter these same rows without resampling. -->
            <Sample size={100_000} seed={42}>
              <Filter where={kept}>
                <Plot bind:this={hr} height={500} axes2d antialias="off"
                  x={{ domain: [2000, 40000], transform: "log", invert: true, label: "temperature (K)", format: "~s" }}
                  y={{ domain: [0.00001, 100000], transform: "log", label: "luminosity (Sun = 1)", format: "~g" }}>
                  <Points x="temperature" y="luminosity" fill="temperature" fillScale={temperatures} shape="square"
                    size={1.2} opacity={0.4} brush respond="brushed" selectionOpacity={0.08} legend={false} />
                </Plot>
              </Filter>
            </Sample>
          </div>
        </div>
      </Calculate>
      </Calculate>
      </Data>
    </Theme>
</div>
</InputContext>

<style>
  /* Python's Scene(gap=12) and Row(wrap=True, min_width=0); both views share one generated table. */
  .scene { display: flex; flex-direction: column; gap: 12px; }
  .scene p { margin: 0; font-size: 14px; line-height: 1.5; }
  .controls { display: flex; flex-wrap: wrap; align-items: center; gap: 20px; }
  /* Three fifths and two fifths, 12 px apart; one column on a narrow screen. */
  .row { display: flex; flex-wrap: wrap; gap: 12px; }
  .main { flex: 3 1 429px; min-width: 0; }
  .side { flex: 2 1 286px; min-width: 0; }
</style>