Brushing frame strips
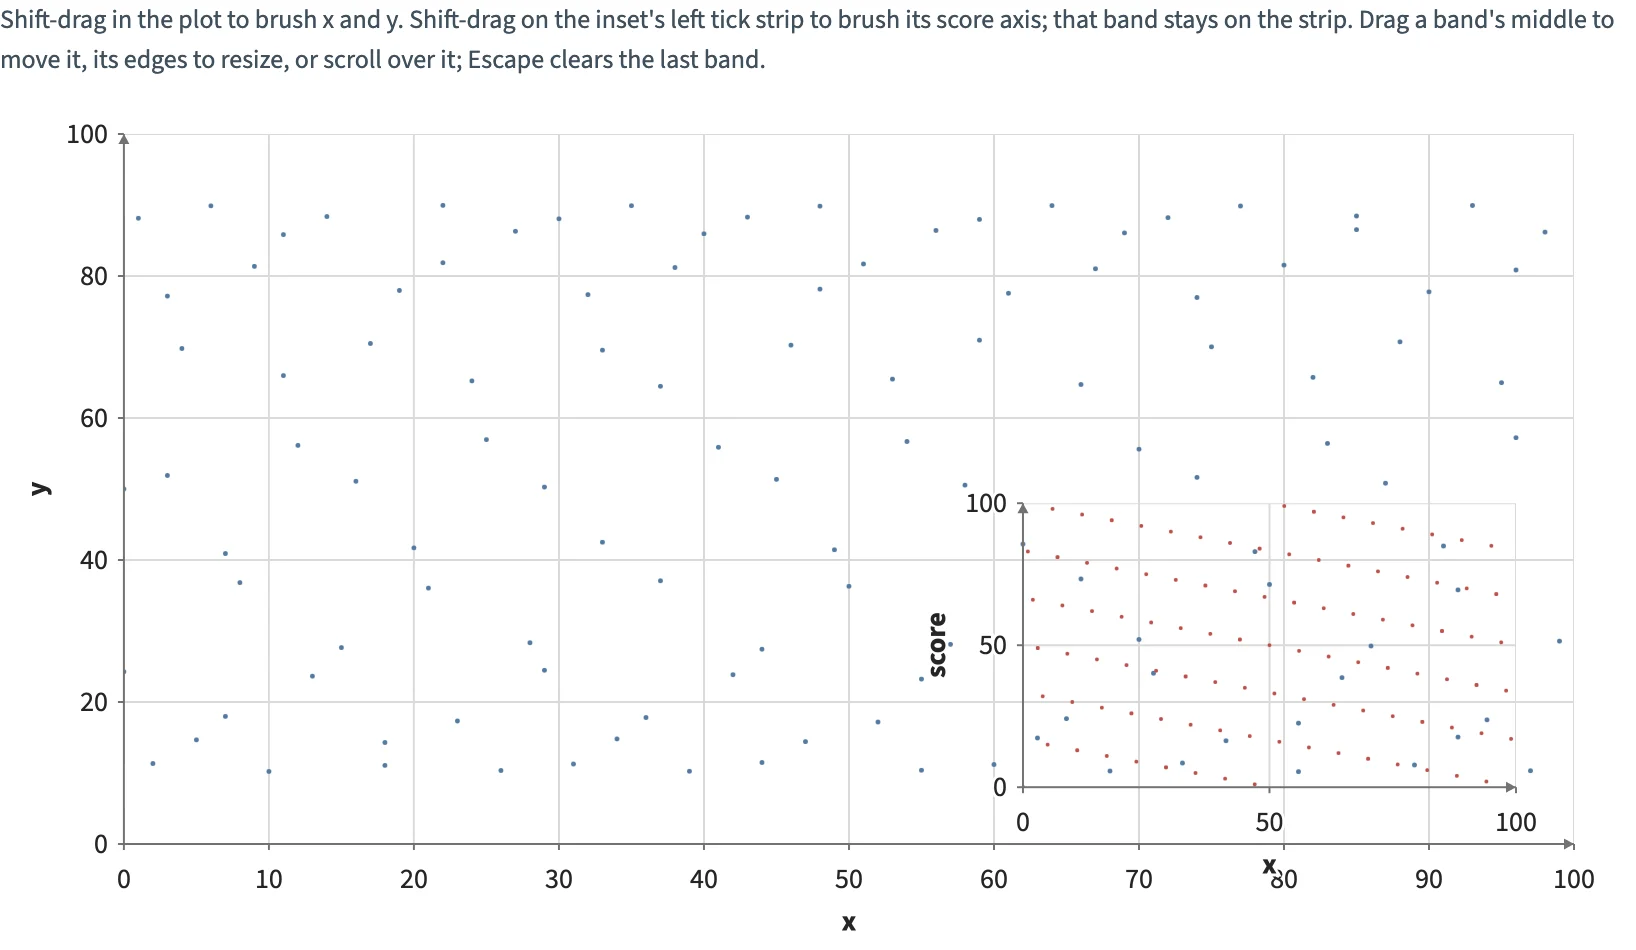
Shift-drag on an inset frame's tick strip to brush its own axis. The band stays on the strip; a column shared with other strips shows on each of them.
Static preview; loading the interactive plot
<script>
  import { Plot, Frame, Points, where } from "hmplot";

  // 120 points, and an inset Frame in the plot's lower right that plots the same rows' score.
  // The inset's points brush only along y, from the tick strip on its left: that band stays on
  // the strip, and the brushed rows grow in both views.
  const rows = {
    x: Array.from({ length: 120 }, (_, i) => (i * 37) % 100),
    y: Array.from({ length: 120 }, (_, i) => 50 + 40 * Math.sin(i * 0.37)),
    score: Array.from({ length: 120 }, (_, i) => (i * 71) % 100),
  };
</script>

<p>Shift-drag in the plot to brush x and y. Shift-drag on the inset's left tick strip to brush its score axis; that band stays on the strip. Drag a band's middle to move it, its edges to resize, or scroll over it; Escape clears the last band.</p>
<Plot data={rows} height={420} axes2d x={{ domain: [0, 100] }} y={{ domain: [0, 100] }}>
  <Points x="x" y="y" brush size={where("@brushed", 4.5, 2.5)} fill="#547ba2" />
  <!-- The inset spans x 62 to 96 and y 8 to 48 of its parent's coordinates. -->
  <Frame x={{ domain: [0, 100], range: [62, 96] }} y={{ domain: [0, 100], range: [8, 48] }}>
    <Points x="x" y="score" brush={{ axis: "y" }} size={where("@brushed", 4, 2)} fill="#c0504d" />
  </Frame>
</Plot>