Long time series
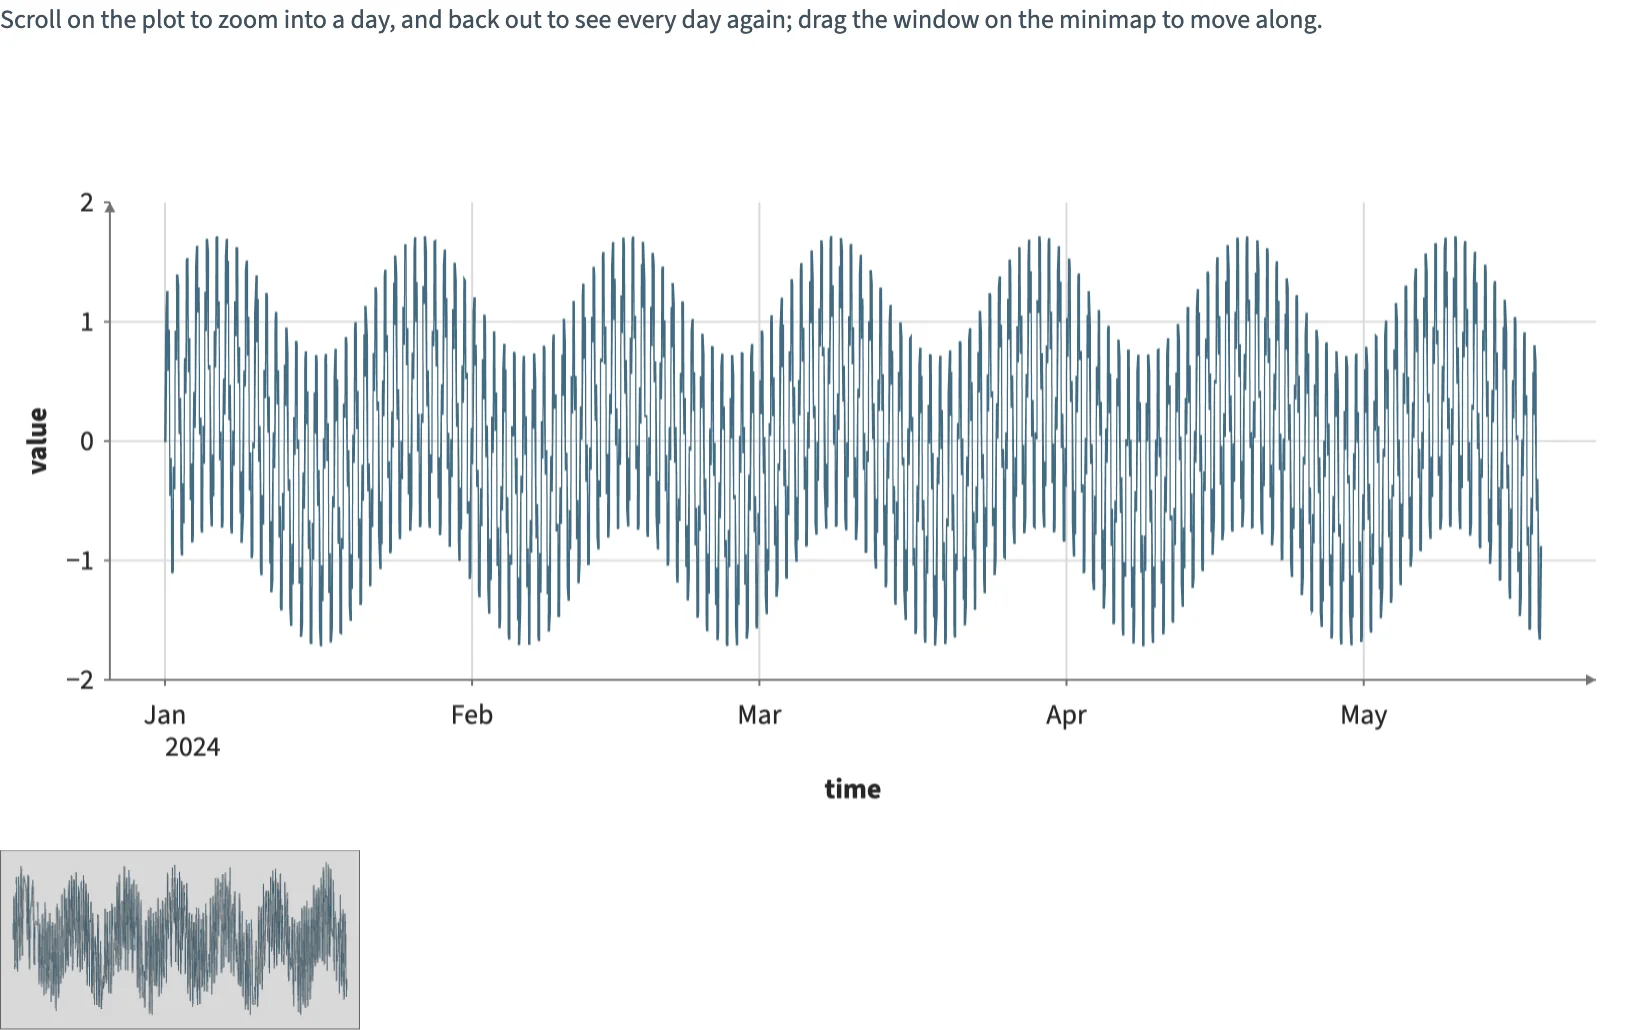
Zoom into a long signal with adaptive peak-preserving detail or draw every point.
Static preview; loading the interactive plot
<script>
  import { InputContext, Select, Plot, Line, Minimap, input } from "hmplot";

  // 200,000 readings, one a minute from the start of 2024 (about 139 days): a daily cycle, a
  // fast wobble and a slow drift. Adaptive detail draws the extremes across the plot's width,
  // which keeps every peak at any zoom; Every point draws all the readings.
  const time = [], value = [];
  for (let minute = 0; minute < 200000; minute++) {
    time.push(1704067200000 + minute * 60000); // milliseconds since 1970, from 2024-01-01 UTC
    value.push(Math.sin(minute * 2 * Math.PI / 1440) + 0.22 * Math.sin(minute * 0.093) + 0.5 * Math.sin(minute * 0.00021));
  }
  let plot = $state();
</script>

<InputContext>
  <p>Scroll on the plot to zoom into a day, and back out to see every day again; drag the window on the minimap to move along.</p>
  <Select name="detail" label="Detail" options={{ "Adaptive detail": "uniform-x", "Every point": "random" }} />
  <Plot bind:this={plot} data={{ time, value }} schema={{ time: { type: "datetime", unit: "ms", timezone: "UTC" } }}
    height={320} axes2d zoomAxis="x" y={{ label: "value" }}>
    <Line x="time" y="value" sampling={input.detail} width={1.25} color="#426c83" />
  </Plot>
  <Minimap for={plot} height={90} />
</InputContext>