Twin coordinate frames
Composable data scopes, coordinate frames, and shared navigation.
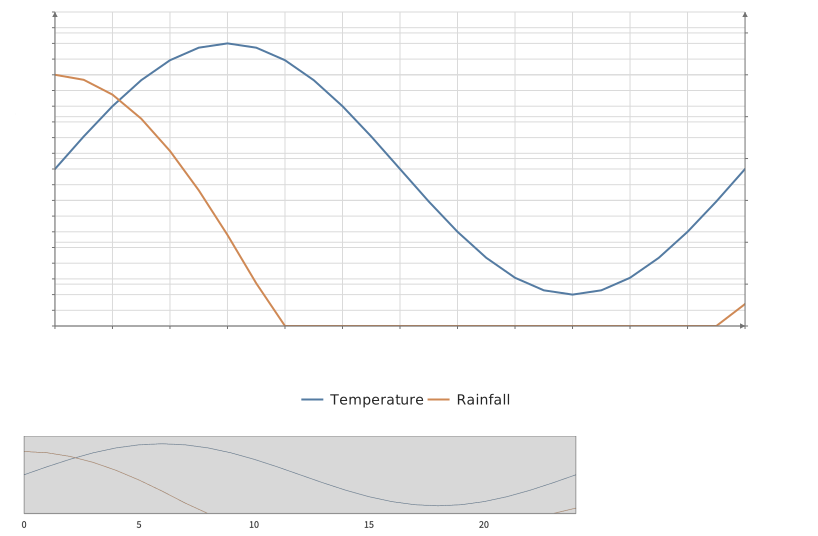
Static preview; loading the interactive plot
<script>
  import { Plot, Frame, Line, Minimap } from "hmplot";

  // A day of weather on two y axes over one hour axis: each Frame has a y scale of its own,
  // temperature on the left and rainfall on the right. The minimap below shows the whole day;
  // drag its window, or zoom the plot, and both lines move together. Its labels follow the
  // rainfall frame's axis.
  const hour = Array.from({ length: 25 }, (_, i) => i);
  const weather = {
    hour,
    temperature: hour.map((h) => 15 + 8 * Math.sin((h / 24) * 2 * Math.PI)),
    rain: hour.map((h) => Math.max(0, 12 * Math.cos(h / 5))),
  };
  let plot = $state(), rainfall = $state();
</script>

<div class="scene">
  <Plot bind:this={plot} data={weather} height={420} legend>
    <Frame name="Temperature" x={{ domain: [0, 24], label: "Hour" }} y={{ domain: [5, 25], label: "Temperature · °C" }}>
      <Line x="hour" y="temperature" color="#547ba2" label="Temperature" />
    </Frame>
    <Frame bind:this={rainfall} name="Rainfall" x={{ domain: [0, 24], visible: false }}
      y={{ domain: [0, 15], label: "Rainfall · mm", side: "right" }}>
      <Line x="hour" y="rain" color="#cf8955" label="Rainfall" />
    </Frame>
  </Plot>
  <Minimap for={plot} axis={rainfall} width={600} height={100} axes={{ x: true, y: false }} />
</div>

<style>
  /* Python's Scene: its children stacked 16 px apart. */
  .scene { display: flex; flex-direction: column; gap: 16px; }
</style>