Keyed updates under interaction
Select a few points, hover, then step the frame or reverse the rows. Surviving IDs retain selection; removed IDs disappear. Point fades last 500 ms and label fades last 200 ms. No automatic timer runs: every update is explicit. Hover size is immediate unless the configured animation applies.
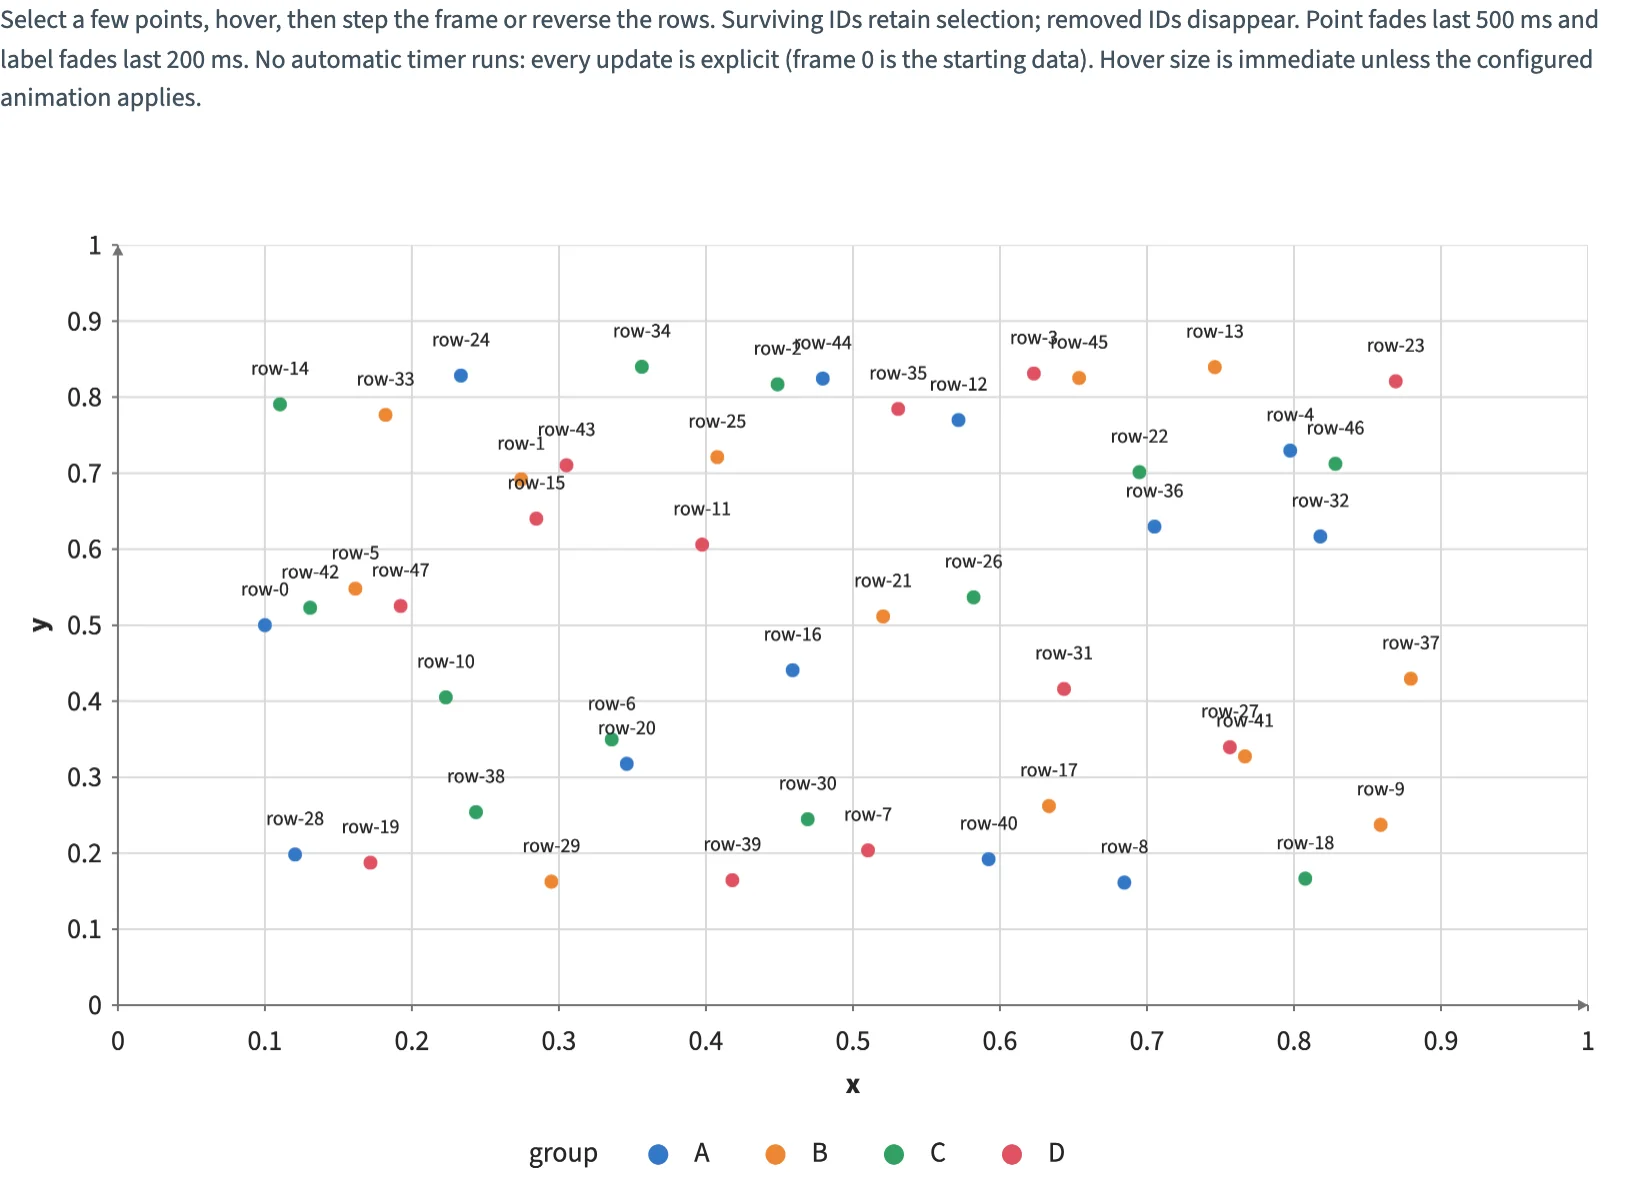
Static preview; loading the interactive plot
<script>
  import { InputContext, Slider, Checkbox, Plot, Calculate, Filter, Sort, Points, Text, input, col, add, subtract,
    multiply, divide, floor, sin, negative, where } from "hmplot";

  // 80 keyed rows. Each frame shows 48 of them: the window starts 8 IDs further on every frame
  // (wrapping around), so 8 IDs leave, 8 enter and the rest move to a new height. The frame and
  // the row order are inputs: every step of the slider, and the checkbox, is one keyed update.
  const k = Array.from({ length: 80 }, (_, i) => i);
  const records = {
    id: k.map((i) => `row-${i}`),
    k,
    group: k.map((i) => ["A", "B", "C", "D"][i % 4]),
    x: k.map((i) => 0.1 + 0.8 * ((i * 17) % 79) / 78),
  };
  // Each row's place in this frame's window (48 or more: not shown), and its height.
  const start = subtract(col.k, multiply(8, input.frame));
  const place = subtract(start, multiply(floor(divide(start, 80)), 80));
  const height = add(0.5, multiply(0.34, sin(add(multiply(col.k, 0.6), multiply(input.frame, 0.12)))));
</script>

<InputContext>
  <p>Select a few points, hover, then step the frame or reverse the rows. Surviving IDs retain selection; removed IDs disappear. Point fades last 500 ms and label fades last 200 ms. No automatic timer runs: every update is explicit (frame 0 is the starting data). Hover size is immediate unless the configured animation applies.</p>
  <div class="controls">
    <Slider name="frame" label="Frame" min={0} max={20} step={1} value={0} />
    <Checkbox name="reverse" label="Reverse row order" />
  </div>
  <Plot data={records} key="id" height={480} axes2d x={{ domain: [0, 1] }} y={{ domain: [0, 1] }}>
    <Calculate columns={{ place, y: height, order: where(input.reverse, negative(place), place) }}>
      <Filter where={{ field: "place", op: "lt", value: 48 }}>
        <Sort by="order">
          <Points x="x" y="y" fill="group" size={where("@hovered", 12, 7)} hover select brush
            respond={["hovered", "selected", "brushed"]} animation animationDuration={500} enterEffect="fade" exitEffect="fade" />
          <Text x="x" y="y" text="id" size={10} dy={-17} respond={["selected", "hovered"]} selectionOpacity={0.15}
            animation animationDuration={200} enterEffect="fade" exitEffect="fade" />
        </Sort>
      </Filter>
    </Calculate>
  </Plot>
</InputContext>

<style>
  /* Python's Scene(gap=12) and Row(wrap=True, min_width=0). */
  .controls { display: flex; flex-wrap: wrap; align-items: center; gap: 16px; margin: 12px 0; }
</style>