Force layout · 2D
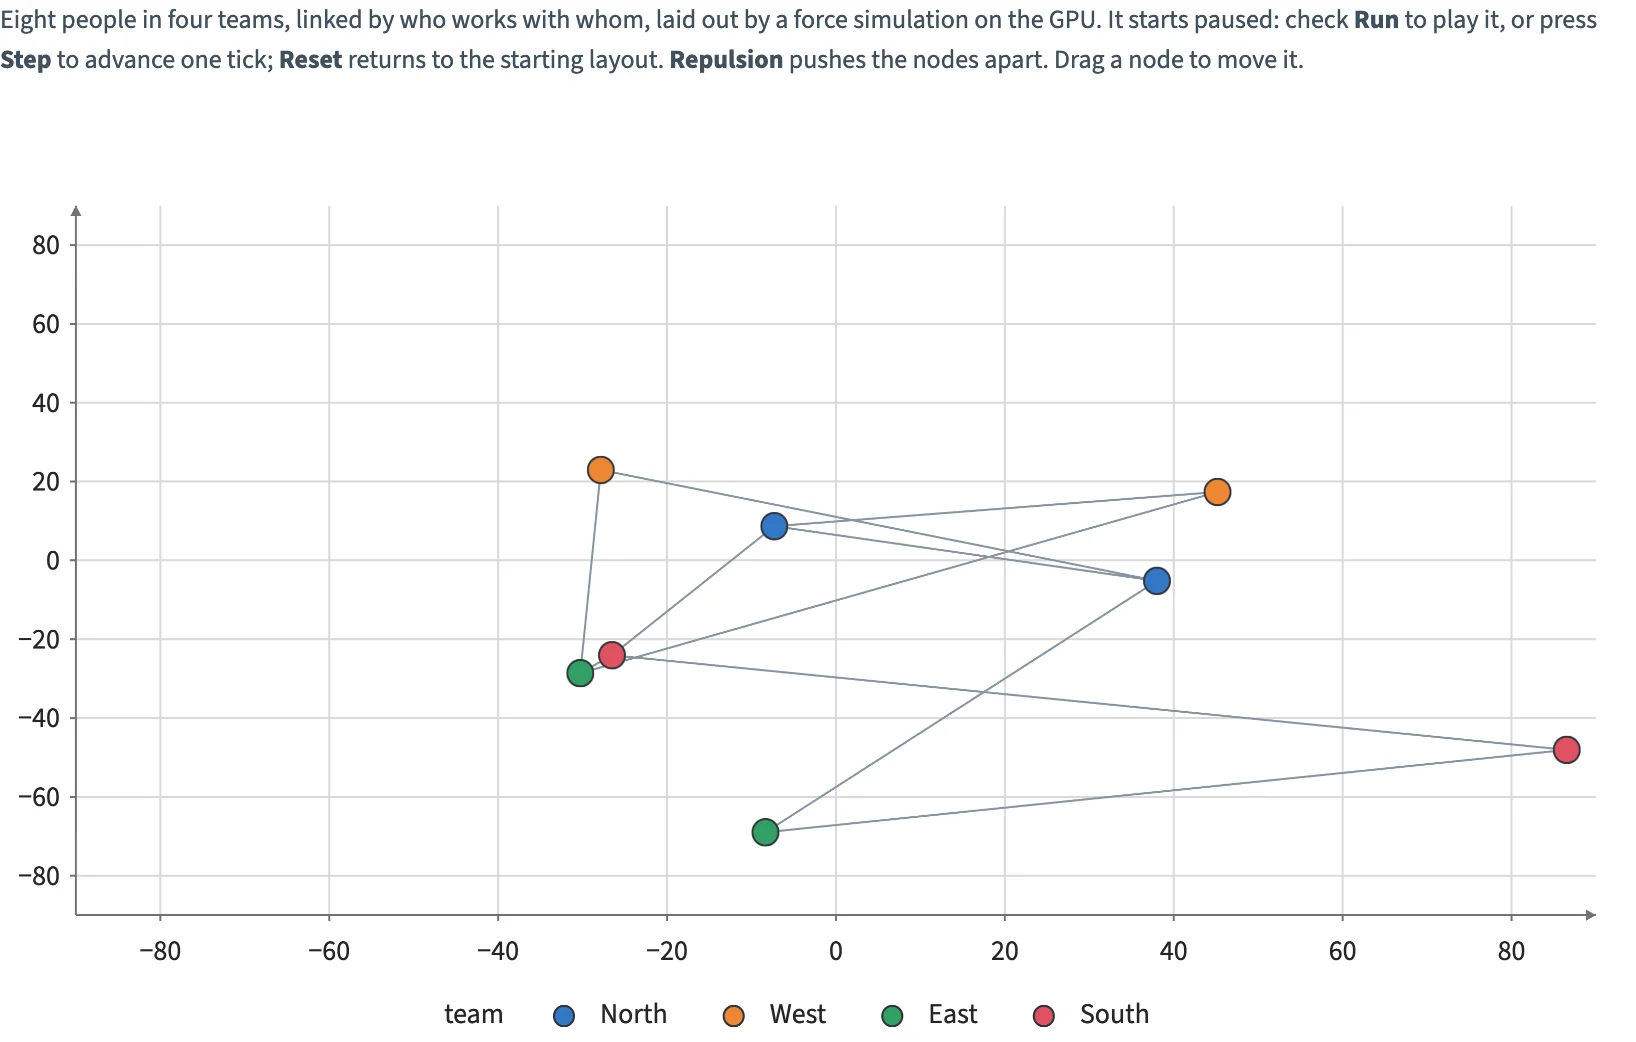
A small team graph laid out by a force simulation on the GPU: run, step, reset, repulsion and dragging.
Static preview; loading the interactive plot
<script>
  import {
    InputContext,
    Checkbox,
    Button,
    Slider,
    Data,
    Force,
    Plot,
    Edges,
    Segments,
    Nodes,
    Points,
    input,
    GraphData,
  } from "hmplot";

  // A small team graph laid out by a force simulation on the GPU. Run plays and pauses it; Step
  // and Reset act on each press (a Button's value counts its presses); Repulsion pushes the nodes
  // apart. Drag a node to move it.
  const links = {
    source: ["A", "A", "B", "B", "C", "D", "E", "F", "G", "H"],
    target: ["B", "C", "D", "E", "F", "F", "G", "H", "H", "A"],
  };
  const people = {
    node: ["A", "B", "C", "D", "E", "F", "G", "H"],
    team: ["North", "North", "West", "West", "East", "East", "South", "South"],
  };
</script>

<InputContext>
  <p>
    Eight people in four teams, linked by who works with whom, laid out by a
    force simulation on the GPU. It starts paused: check <strong>Run</strong> to
    play it, or press <strong>Step</strong> to advance one tick;
    <strong>Reset</strong>
    returns to the starting layout. <strong>Repulsion</strong> pushes the nodes apart.
    Drag a node to move it.
  </p>
  <div class="controls">
    <Checkbox name="run" label="Run" />
    <Button name="step" label="Step" />
    <Button name="restart" label="Reset" />
    <Slider
      name="repulsion"
      min={0}
      max={200}
      step={1}
      value={30}
      label="Repulsion"
    />
  </div>
  <Data value={links}>
    <GraphData
      nodes={people}
      edges={links}
      nodeKey="node"
      source="source"
      target="target"
      ><Force
        dimensions={2}
        running={input("run")}
        step={input("step")}
        reset={input("restart")}
        repulsion={input("repulsion")}
      >
        <Plot
          height={420}
          axes2d
          x={{ domain: [-90, 90] }}
          y={{ domain: [-90, 90] }}
        >
          <Edges>
            <Segments
              start="start"
              end="end"
              color="#8694a0"
              width={1}
            />
          </Edges>
          <Nodes drag>
            <Points
              position="position"
              fill="team"
              size={14}
              outlineColor="#30343b"
              outlineWidth={1.05}
            />
          </Nodes>
        </Plot>
      </Force></GraphData
    >
  </Data>
</InputContext>

<style>
  /* Python's Scene(gap=12) and Row(wrap=True, min_width=0). */
  .controls {
    display: flex;
    flex-wrap: wrap;
    align-items: center;
    gap: 16px;
    margin: 12px 0;
  }
</style>