Zoomable sunburst
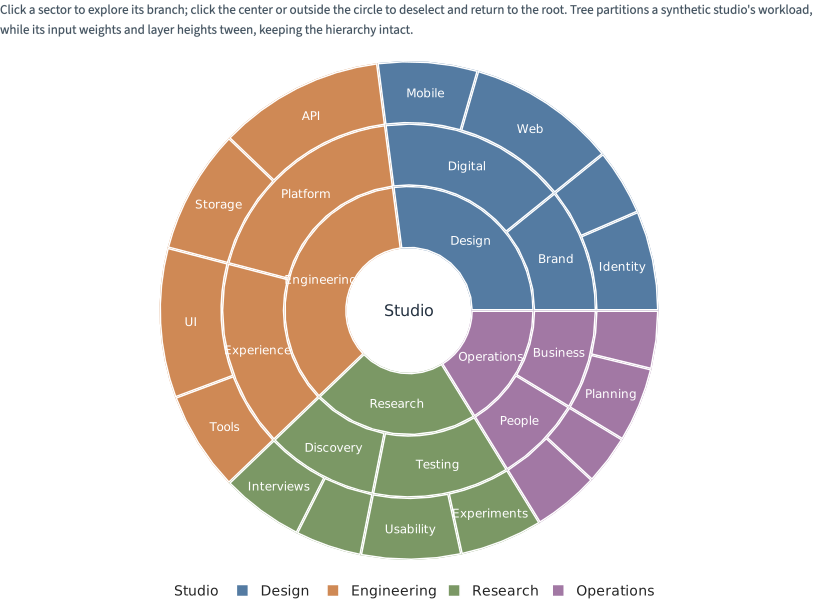
Click to explore a weighted Tree partition with input weights and layer heights tweened before layout. The Svelte and Python scenes work in standalone HTML.
Static preview; loading the interactive plot
<script>
  import {
    Plot,
    Tree,
    Nodes,
    Filter,
    Rect,
    Text,
    Legend,
    col,
    view,
    where,
    min,
    max,
    sum,
    equal,
    greater,
    tween,
    logical_and,
    greater_equal,
    not_equal,
    less,
    subtract,
    multiply,
    divide,
    GraphData,
    animate,
    categorical,
  } from "hmplot";
  import { untrack } from "svelte";
  let { onready } = $props(),
    plot = $state(),
    sectors = $state();

  const hierarchy = [
    "Studio",
    [
      [
        "Design",
        [
          [
            "Brand",
            [
              ["Identity", 12],
              ["Type", 8],
            ],
          ],
          [
            "Digital",
            [
              ["Web", 18],
              ["Mobile", 12],
            ],
          ],
        ],
      ],
      [
        "Engineering",
        [
          [
            "Platform",
            [
              ["API", 20],
              ["Storage", 15],
            ],
          ],
          [
            "Experience",
            [
              ["UI", 18],
              ["Tools", 12],
            ],
          ],
        ],
      ],
      [
        "Research",
        [
          [
            "Discovery",
            [
              ["Interviews", 10],
              ["Fieldwork", 8],
            ],
          ],
          [
            "Testing",
            [
              ["Usability", 12],
              ["Experiments", 10],
            ],
          ],
        ],
      ],
      [
        "Operations",
        [
          [
            "People",
            [
              ["Hiring", 8],
              ["Learning", 6],
            ],
          ],
          [
            "Business",
            [
              ["Planning", 9],
              ["Finance", 7],
            ],
          ],
        ],
      ],
    ],
  ];
  // Preorder IDs and stop mark each input subtree; Tree calculates all geometry.
  const nodes = [],
    edges = [];
  function visit([name, children], up = 0, group = "Design", level = 0) {
    const id = nodes.length,
      branch = Array.isArray(children);
    const row = {
      id,
      name,
      up,
      group,
      level,
      branch: Number(branch),
      value: branch ? 1 : children,
    };
    nodes.push(row);
    if (id) edges.push({ source: up, target: id });
    if (branch)
      for (const child of children)
        visit(child, id, id === 0 ? child[0] : group, level + 1);
    row.stop = nodes.length;
  }
  visit(hierarchy);
  for (const row of nodes) {
    row.upStop = nodes[row.up].stop;
    row.upLevel = nodes[row.up].level;
  }
  const selected = sum(view.selected);
  const focus = where(
    selected,
    min(where(view.selected, where(col.branch, col.id, col.up), nodes.length)),
    0,
  );
  const stop = where(
    selected,
    max(where(view.selected, where(col.branch, col.stop, col.upStop), 0)),
    nodes.length,
  );
  const level = where(
    selected,
    max(where(view.selected, where(col.branch, col.level, col.upLevel), 0)),
    0,
  );
  const inside = logical_and(greater_equal(col.id, focus), less(col.id, stop));
  const shown = logical_and(inside, logical_and(greater_equal(col.level, level), not_equal(col.id, focus)));
  // Tween inputs BEFORE partitioning: whole subtrees shrink/grow together.
  const width = tween(where(inside, col.value, 0), { duration: 650 });
  const height = tween(where(less(col.level, level), 0, 1), { duration: 650 });
  // Marks fade independently while Tree's current geometry continues to reflow.
  const fade = { effect: "fade", duration: 650 };
  const visible = logical_and(greater(col.x1, col.x0), greater(col.y1, col.y0));
  const labelSpace = multiply(
    multiply(divide(subtract(col.x1, col.x0), max(col.x1)), 360),
    divide(col.y0, max(col.y1)),
  );
  const labelShown = logical_and(
    inside,
    logical_and(visible, logical_and(greater(labelSpace, 13), greater(col.level, level))),
  );
  $effect(() => {
    const p = plot;
    untrack(() => onready?.(p));
  });
</script>

<p>
  Click a sector to explore its branch; click the center or outside the circle
  to deselect and return to the root. Tree partitions a synthetic studio's
  workload while its input weights and layer heights tween, keeping the
  hierarchy intact.
</p>
<Plot
  bind:this={plot}
  data={edges}
  coordinates="polar"
  angleUnit="extent"
  x={{ padding: 0 }}
  responsive
  height={560}
>
  <GraphData {nodes} {edges} nodeKey="id" source="source" target="target"
    ><Tree
      root={0}
      directed
      mode="partition"
      orientation="up"
      nodeWidth={width}
      layerHeight={height}
    >
      <Nodes>
        <Filter where={greater(col.depth, 0)}>
          <Rect
            bind:this={sectors}
            x0="x0"
            x1="x1"
            y0="y0"
            y1="y1"
            fill={animate("group", { duration: 650 })}
            fillScale={categorical({ domain: ["Design", "Engineering", "Research", "Operations"] })}
            outlineColor="#ffffff"
            outlineWidth={1.5}
            opacity={animate(where(shown, 1, 0), {
              duration: 650, enter: 0, exit: 0,
            })}
            enterEffect={fade}
            exitEffect={fade}
            select
            respond={false}
            tooltip={["name", "value"]}
            label="Studio workload"
          />
        </Filter>
        <!-- Keep fading labels in the table so they follow Tree's current geometry. -->
        <Filter where={greater(col.depth, 0)}>
          <Text x="x" y="y" text="name" color="#ffffff" size={12}
            opacity={animate(where(labelShown, 1, 0), { duration: 650, enter: 0, exit: 0 })}
            enterEffect={fade} exitEffect={fade} />
        </Filter>
        <Filter where={equal(col.id, focus)}>
          <Text x={0} y={0} text="name" color="#263342" size={16}
            opacity={animate(1, { duration: 650, enter: 0, exit: 0 })}
            enterEffect={fade} exitEffect={fade} />
        </Filter>
      </Nodes>
    </Tree></GraphData
  >
  <Legend for={sectors} channel="fill" label="Studio" position="bottom" />
</Plot>

<style>
  p {
    font-size: 14px;
    line-height: 1.5;
  }
</style>