Keyed enter and exit
Keep matching observations continuous while new keys enter and removed keys exit.
Static preview; loading the interactive plot
<script>
  import { InputContext, Button, Plot, Data, Calculate, Filter, Points, Text, input, col, where, equal, floor,
    subtract, multiply, divide, is_finite } from "hmplot";

  // Three keyed states of a few observations. Each press of the button moves to the next state:
  // observations whose id stays move, new ids fade in and removed ids fade out.
  const states = [
    { A: [0.18, 0.28], B: [0.39, 0.65], C: [0.65, 0.32] },
    { B: [0.27, 0.55], C: [0.58, 0.56], D: [0.82, 0.72] },
    { A: [0.24, 0.72], C: [0.53, 0.25], E: [0.75, 0.48] },
  ];
  // One row per id, with its position in each state (missing where the state leaves it out).
  const ids = ["A", "B", "C", "D", "E"];
  const observations = { id: ids };
  states.forEach((state, s) => {
    observations[`x${s}`] = ids.map((id) => state[id]?.[0] ?? NaN);
    observations[`y${s}`] = ids.map((id) => state[id]?.[1] ?? NaN);
  });
  // The status line of each state, drawn in the plot's corner.
  const labels = { state: [0, 1, 2], text: states.map((state, s) => `State ${s + 1}: ${Object.keys(state).join(", ")}`) };

  // The button counts its presses: the state is that count modulo 3.
  const stage = subtract(input.next, multiply(floor(divide(input.next, 3)), 3));
  const atStage = (column) => where(equal(stage, 0), col[`${column}0`], where(equal(stage, 1), col[`${column}1`], col[`${column}2`]));
</script>

<InputContext>
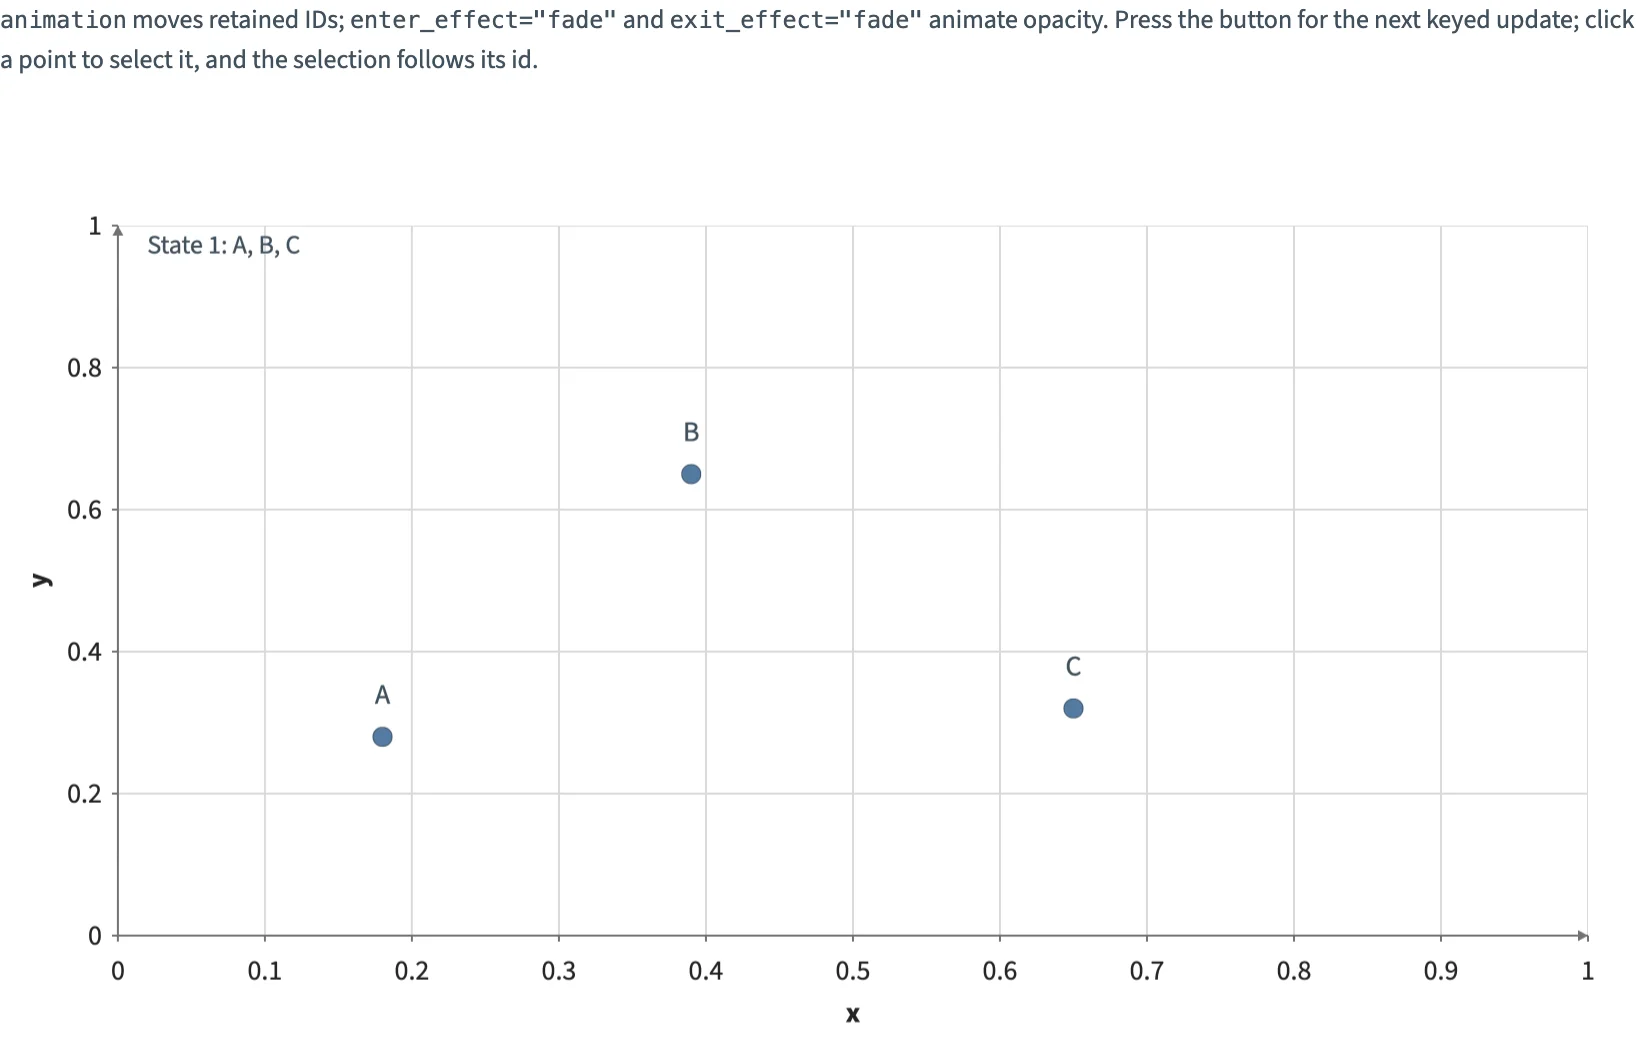
  <p><code>animation</code> moves retained IDs; <code>enterEffect="fade"</code> and <code>exitEffect="fade"</code> animate opacity. Press the button for the next keyed update; click a point to select it, and the selection follows its id.</p>
  <Button name="next" label="Next keyed update" />
  <Plot height={420} axes2d animationDuration={550} x={{ domain: [0, 1] }} y={{ domain: [0, 1] }}>
    <Data value={observations} key="id">
      <Calculate columns={{ x: atStage("x"), y: atStage("y") }}>
        <Filter where={is_finite(col.x)}>
          <Points x="x" y="y" size={10} fill="#547ba2" outlineColor="#263545" outlineWidth={0.4}
            animation enterEffect="fade" exitEffect="fade" select respond="selected" />
          <Text x="x" y="y" text="id" dy={-20} size={14} color="#40505d" animation enterEffect="fade" exitEffect="fade" />
        </Filter>
      </Calculate>
    </Data>
    <Data value={labels}>
      <Filter where={equal(col.state, stage)}>
        <Text x={0.02} y={0.97} text="text" align="left" size={13} color="#40505d" />
      </Filter>
    </Data>
  </Plot>
</InputContext>