Large force graph
Explore seeded graphs of 64 to 10,000 nodes, thin edges, dragging, and a linked overview in 2D or 3D.
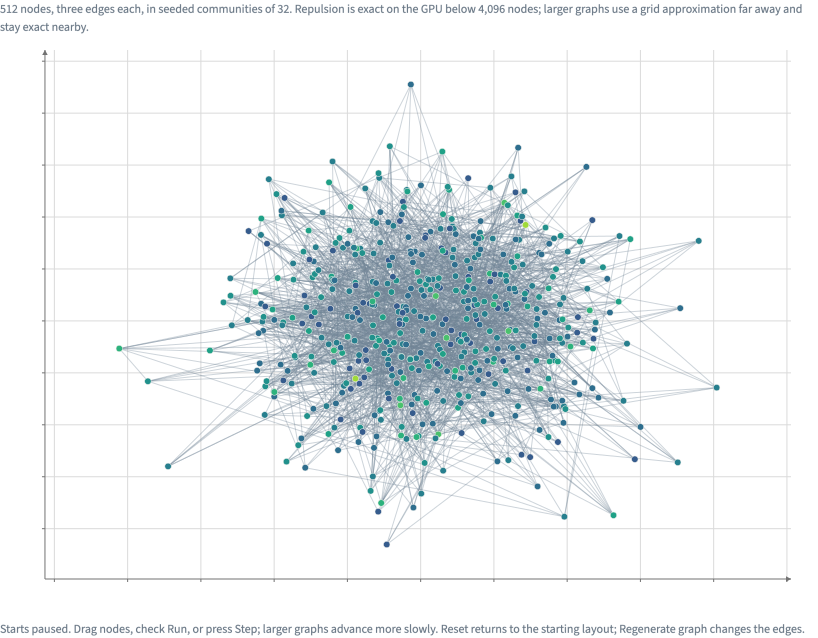
Static preview; loading the interactive plot
<script>
  import {
    InputContext,
    Select,
    Checkbox,
    Button,
    Data,
    Transform,
    Force,
    Plot,
    Edges,
    Segments,
    Nodes,
    Points,
    input,
    continuous,
  } from "hmplot";

  // Generate only the selected graph, through the same bundled plugin Python uses.
  const SIZES = [64, 128, 256, 512, 1024, 2048, 10000, 100000];
  const sizes = Object.fromEntries(
    SIZES.map((n) => [n.toLocaleString("en-US"), n]),
  );
  // A Plot's type and a Force's dimensions are props of their own: the Dimensions select sets
  // them through `view`.
  let view = $state("2d"),
    nodes = $state(512);
</script>

<InputContext>
  <div class="controls">
    <Select name="nodes" label="Nodes" options={sizes} bind:value={nodes} />
    <Select
      name="view"
      label="Dimensions"
      options={{ "2D": "2d", "3D": "3d" }}
      bind:value={view}
    />
    <Checkbox name="run" label="Run" />
    <Button name="step" label="Step" />
    <Button name="restart" label="Reset" />
    <Button name="regenerate" label="Regenerate graph" value={42} />
  </div>
  <p class="note">
    {nodes.toLocaleString("en-US")} nodes, three edges each, in seeded communities
    of 32. Repulsion is exact on the GPU below 4,096 nodes; larger graphs use a grid
    approximation far away and stay exact nearby.
  </p>
  <Data rows={1}>
    <Transform
      kind="community-graph"
      params={{ nodes: input.nodes, seed: input.regenerate }}
    >
      <!-- The layout's dimensions follow the view: 3 for a 3D plot, 2 for a 2D one. -->
      <Force
        dimensions={view === "3d" ? 3 : 2}
        linkDistance={12}
        repulsion={50}
        running={input("run")}
        step={input("step")}
        reset={input("restart")}
      >
        <!-- overview: the linked minimap of the whole graph. -->
        <Plot type={view} height={560} overview>
          <Edges>
            <Segments
              start="start"
              end="end"
              color="#718394"
              opacity={0.35}
              width={1}
            />
          </Edges>
          <Nodes drag>
            <Points
              position="position"
              fill="degree"
              fillScale={continuous({ domain: [0, 14] })}
              size={7}
              outlineColor="#f4f2ed"
              outlineWidth={0.5}
            />
          </Nodes>
        </Plot>
      </Force>
    </Transform>
  </Data>
  <p class="note">
    Starts paused. Drag nodes, check Run, or press Step; larger graphs advance
    more slowly. Reset returns to the starting layout; Regenerate graph changes
    the edges.
  </p>
</InputContext>

<style>
  /* Python's Scene(gap=12), Row(wrap=True, min_width=0) and Markdown(font_size=12, color="#697785"). */
  .controls {
    display: flex;
    flex-wrap: wrap;
    align-items: center;
    gap: 16px;
  }
  .note {
    font-size: 12px;
    color: #697785;
    margin: 12px 0;
  }
</style>