Histogram bins
A Slider input sets a Histogram's bin count.
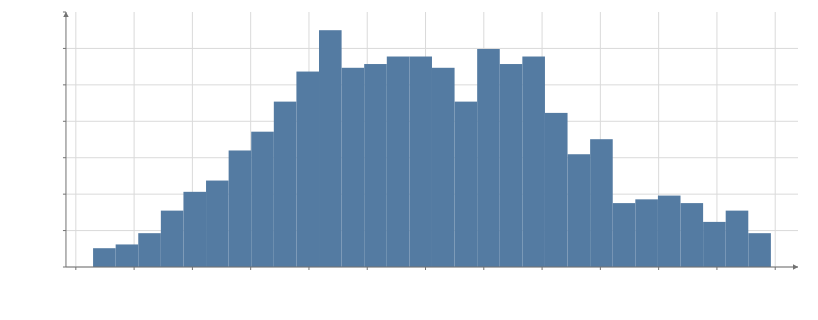
Static preview; loading the interactive plot
<script>
  import { InputContext, Slider, Plot, input } from "hmplot";
import { Histogram } from "hmplot/charts";

  // A thousand measurements, the sum of three waves, so the counts have some shape. The slider
  // sets the number of bins; the Histogram re-bins on the GPU as it moves.
  const value = Array.from({ length: 1000 }, (_, i) => Math.sin(i * 0.37) + Math.sin(i * 0.11) + Math.cos(i * 0.053));
</script>

<InputContext>
  <Slider name="bins" min={4} max={80} step={1} value={30} label="Bins" />
  <Plot data={{ value }} axes2d height={320}>
    <Histogram x="value" bins={input("bins")} normalization="density" fill="#547ba2" />
  </Plot>
</InputContext>