Violin plot
Grouped GPU density bands with categorical color.
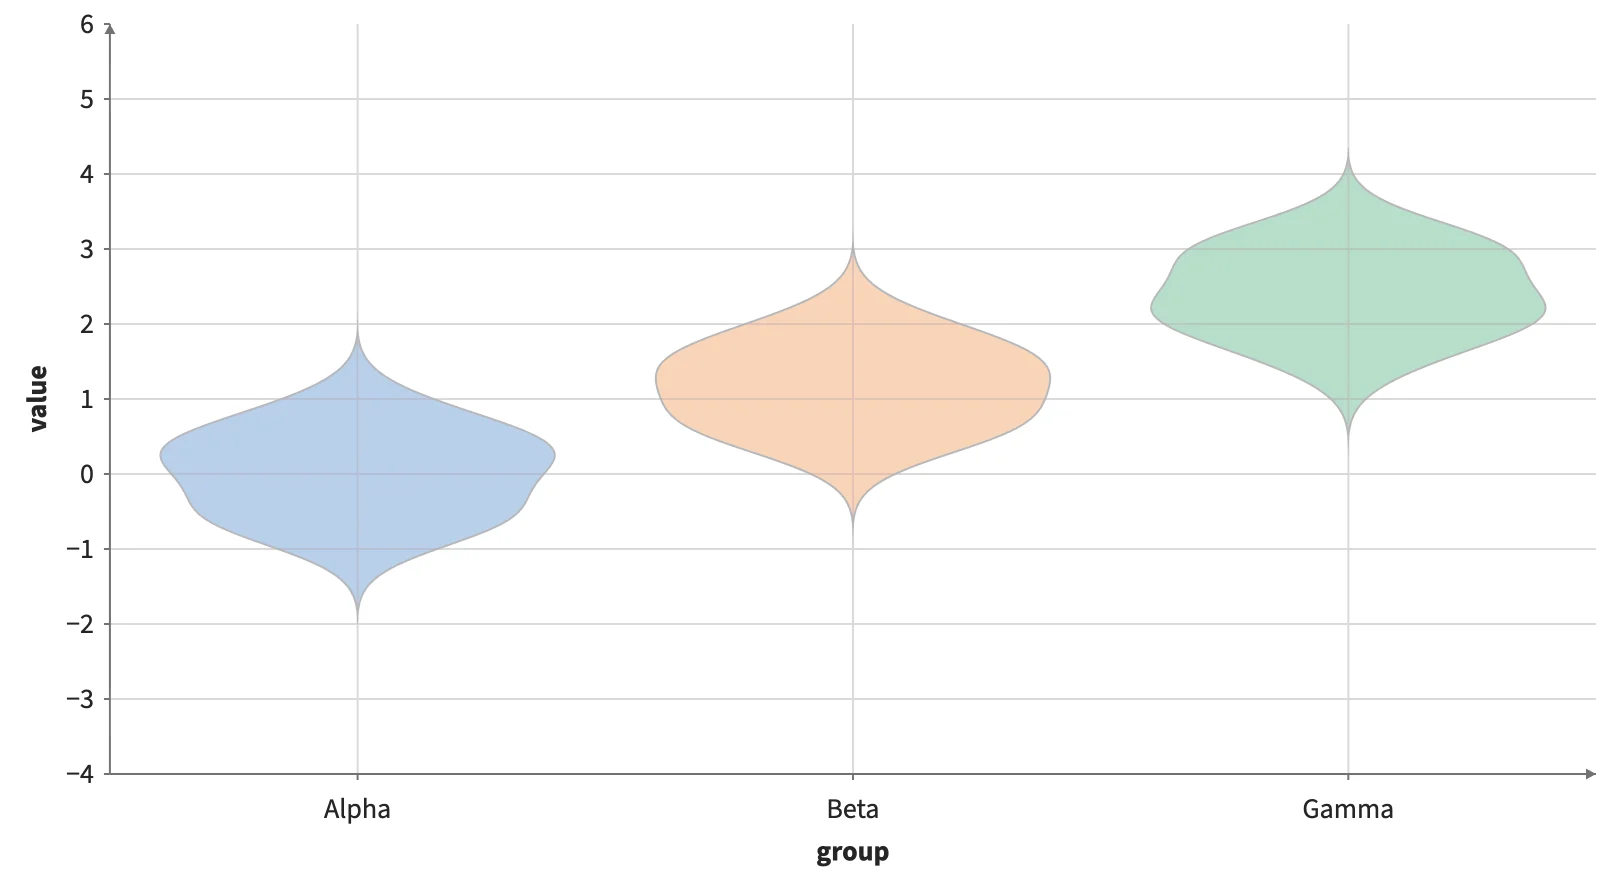
Static preview; loading the interactive plot
<script>
  import { Plot, categorical } from "hmplot";
import { Violin } from "hmplot/charts";

  // 240 values in three groups, each group a little higher than the last. Violin estimates each
  // group's density on the GPU and mirrors it into a band; the categorical scale keeps the
  // groups' order.
  const groups = ["Alpha", "Beta", "Gamma"];
  const values = Array.from({ length: 240 }, (_, i) => ({
    group: groups[i % 3],
    value: (i % 3) * 1.2 + Math.sin(i * 2.17) * 0.7 + Math.cos(i * 0.31) * 0.25,
  }));
</script>

<Plot data={values} x={{ scale: categorical({ domain: groups }) }} height={440} axes2d>
  <Violin x="group" y="value" fill="group" outlineColor="#30343b" />
</Plot>