Polar and tangent insets
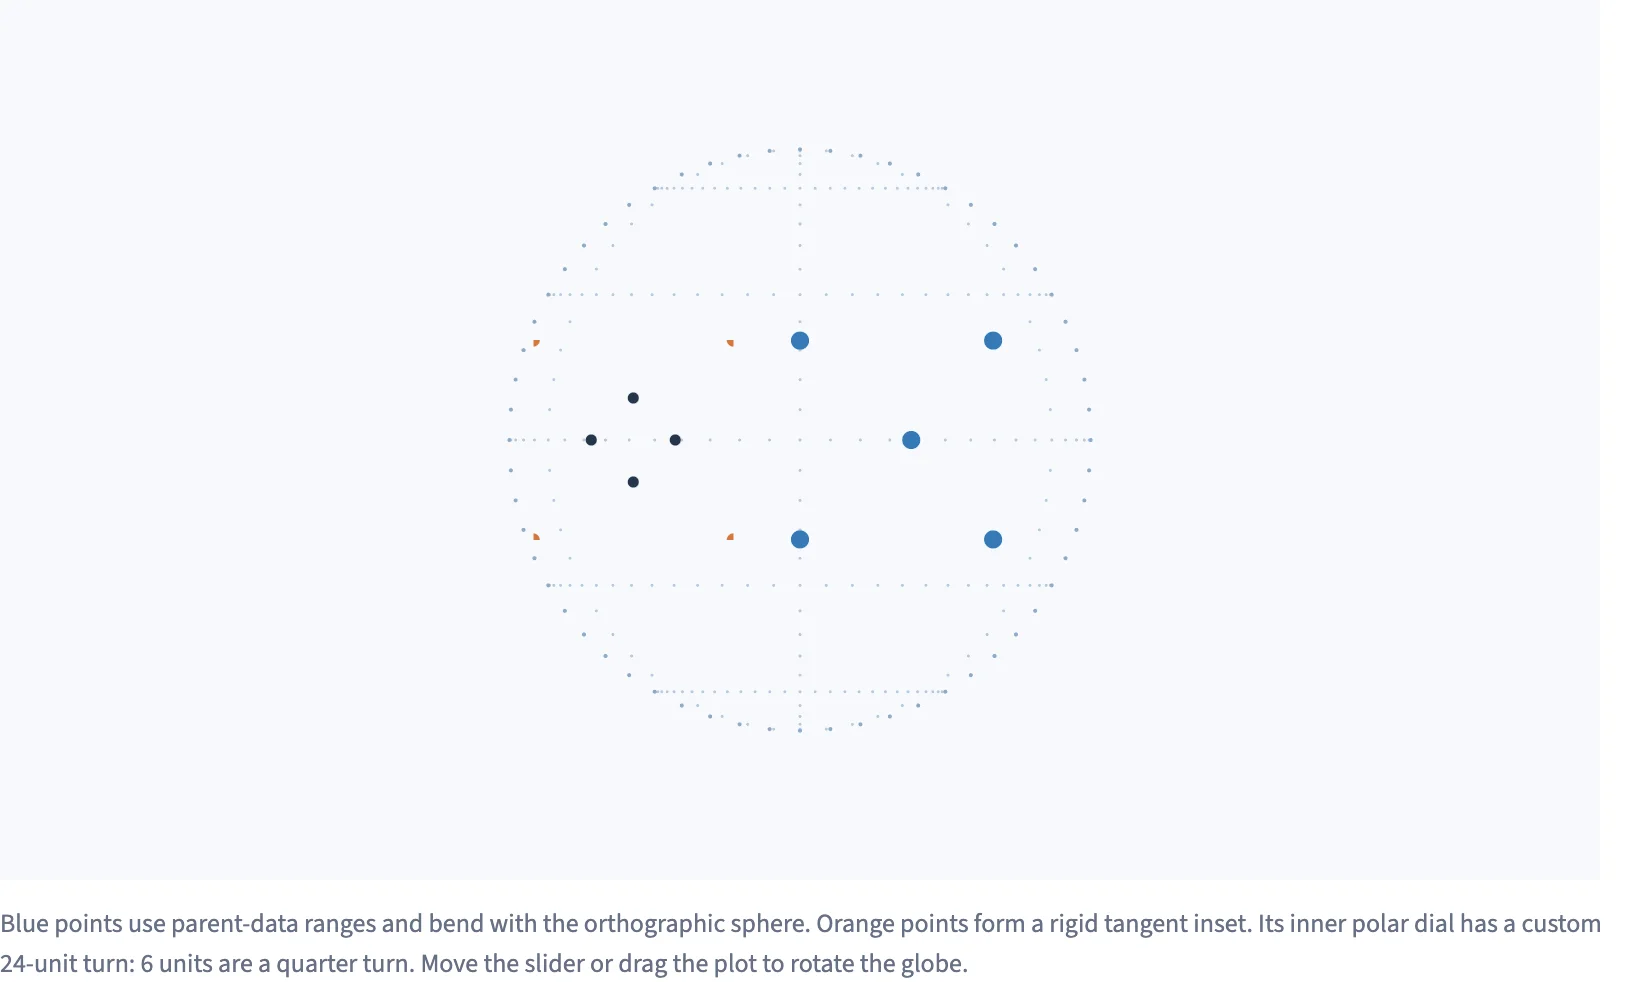
A warped chart and a rigid tangent inset on a rotatable orthographic sphere, with a 24-unit polar dial.
Static preview; loading the interactive plot
<script>
  import { InputContext, Slider, Data, Calculate, Plot, Frame, Points, col, input, add } from "hmplot";

  // A warped chart and a rigid tangent inset on an orthographic sphere, and a polar dial inside
  // the inset with a 24-unit turn. The slider turns the globe (its projection center); dragging
  // the plot turns it too.
  const latitudes = Array.from({ length: 31 }, (_, i) => -90 + 6 * i);
  const longitudes = Array.from({ length: 61 }, (_, i) => -180 + 6 * i);
  const graticule = [
    ...[-120, -60, 0, 60, 120, 180].flatMap((lon) => latitudes.map((lat) => [lon, lat])),
    ...[-60, -30, 0, 30, 60].flatMap((lat) => longitudes.map((lon) => [lon, lat])),
  ];
  // The horizon: the meridians 90 degrees either side of the center, which follow the slider.
  const horizon = { lat: [...latitudes, ...latitudes], side: [...latitudes.map(() => -90), ...latitudes.map(() => 90)] };
  // The globe's center, for its projection: a Frame's own prop, so the slider sets it through `center`.
  let center = $state(0);
</script>

<InputContext>
  <div class="controls">
    <Slider name="center" label="Globe center" min={-60} max={60} format=".0f" bind:value={center} />
  </div>
  <Plot type="2d" height={440} background="#f7f9fc">
    <Frame name="Globe" coordinates="spherical" projection="orthographic" projectionCenter={[center, 0]}
      x={{ domain: [-180, 180], visible: false }} y={{ domain: [-90, 90], visible: false }}>
      <Points position={graticule} size={1.5} fill="#b7c9dc" />
      <Data value={horizon}>
        <Calculate columns={{ lon: add(input.center, col.side) }}>
          <Points x="lon" y="lat" size={2} fill="#8faac5" />
        </Calculate>
      </Data>
      <!-- Parent-data ranges: the chart covers 0 to 45 degrees east and 20 degrees either side of
           the equator, and bends with the sphere. -->
      <Frame name="Warped chart" coordinates="cartesian"
        x={{ domain: [-1, 1], range: [0, 45], visible: false }} y={{ domain: [-1, 1], range: [-20, 20], visible: false }}>
        <Points position={[[-1, -1], [1, -1], [-1, 1], [1, 1], [0, 0]]} size={9} fill="#3679b7" />
      </Frame>
      <!-- A placement: a rigid 100-pixel square on the surface at 35 degrees west, facing out. -->
      <Frame name="Tangent inset" coordinates="cartesian"
        placement={{ anchor: [-35, 0], size: [100, 100], orientation: "tangent" }}
        x={{ domain: [-1, 1], visible: false }} y={{ domain: [-1, 1], visible: false }}>
        <Points position={[[-1, -1], [1, -1], [-1, 1], [1, 1]]} size={6.5} fill="#d4773e" />
        <Frame name="Polar dial" coordinates="polar" angleUnit="custom" anglePeriod={24}
          placement={{ anchor: [0, 0], size: [42, 42] }}
          x={{ domain: [0, 24], visible: false }} y={{ domain: [0, 1], visible: false }}>
          <Points position={[[0, 1], [6, 1], [12, 1], [18, 1]]} size={5.5} fill="#26364b" />
        </Frame>
      </Frame>
    </Frame>
  </Plot>
  <p class="note">Blue points use parent-data ranges and bend with the orthographic sphere. Orange points form a rigid tangent inset. Its inner polar dial has a custom 24-unit turn: 6 units are a quarter turn. Move the slider or drag the plot to rotate the globe.</p>
</InputContext>

<style>
  /* Python's Scene(gap=12), Row(wrap=True, min_width=0) and Markdown(font_size=13, color="#667085"). */
  .controls { display: flex; flex-wrap: wrap; align-items: center; gap: 16px; margin-bottom: 12px; }
  .note { font-size: 13px; color: #667085; margin-top: 12px; }
</style>