Earth relief
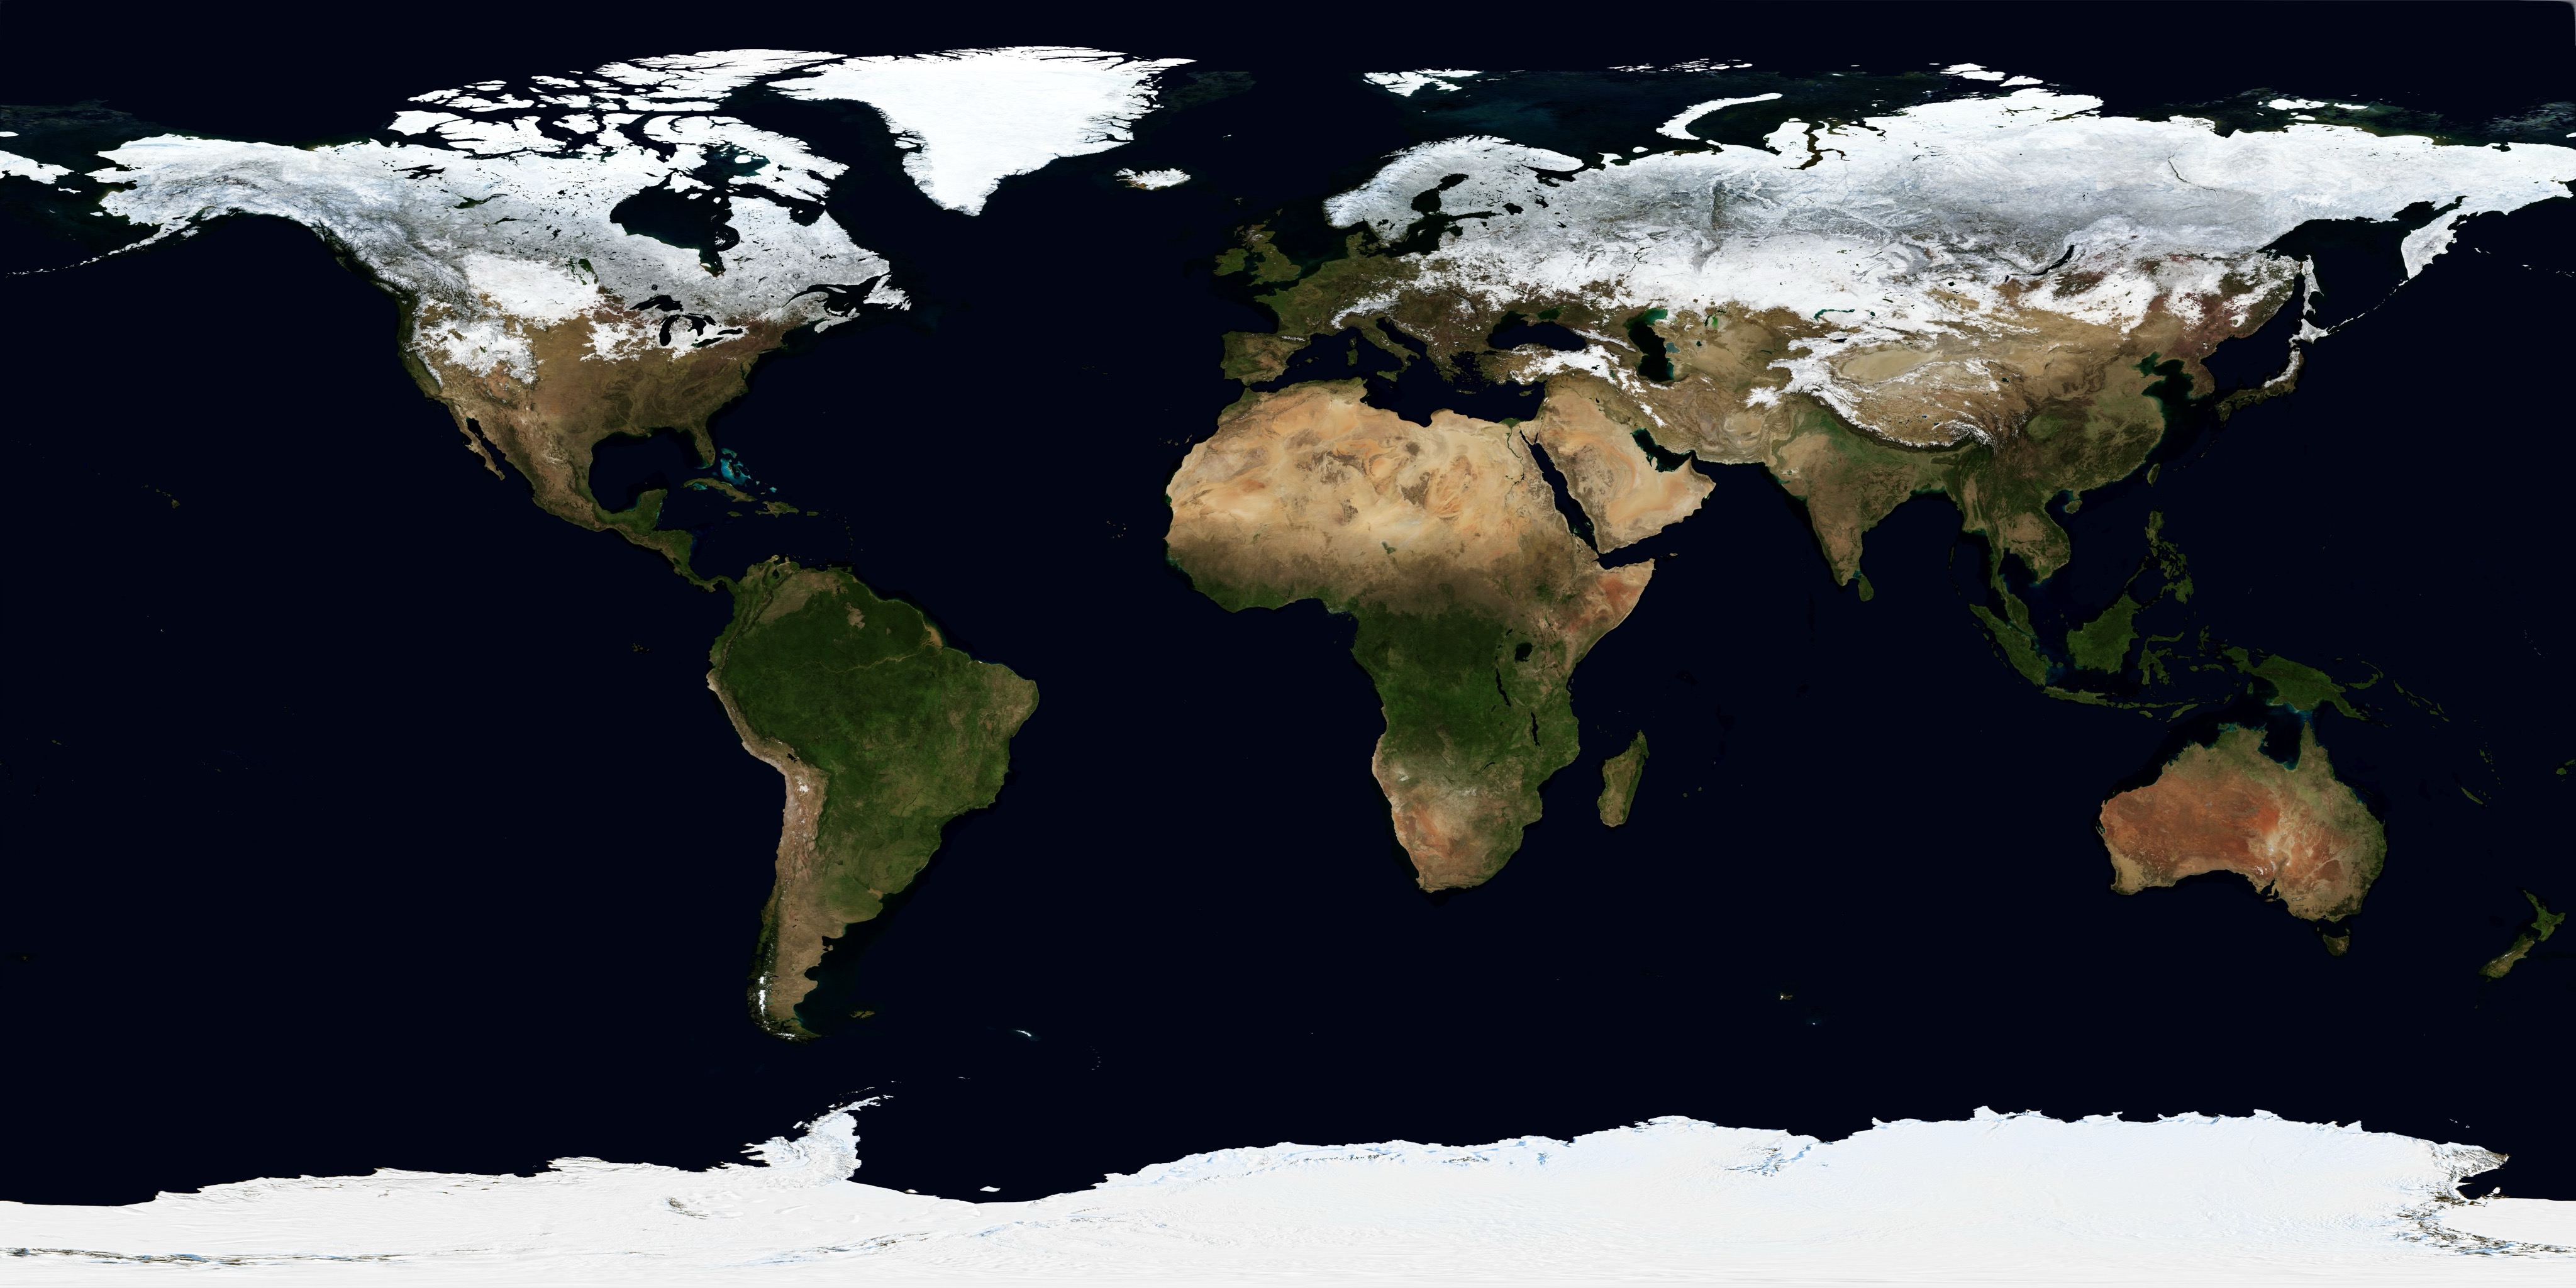
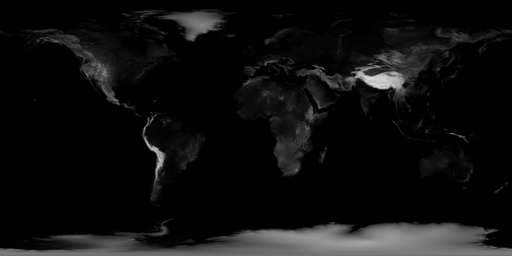
NASA imagery over an elevation surface, with adjustable relief and directional lighting.
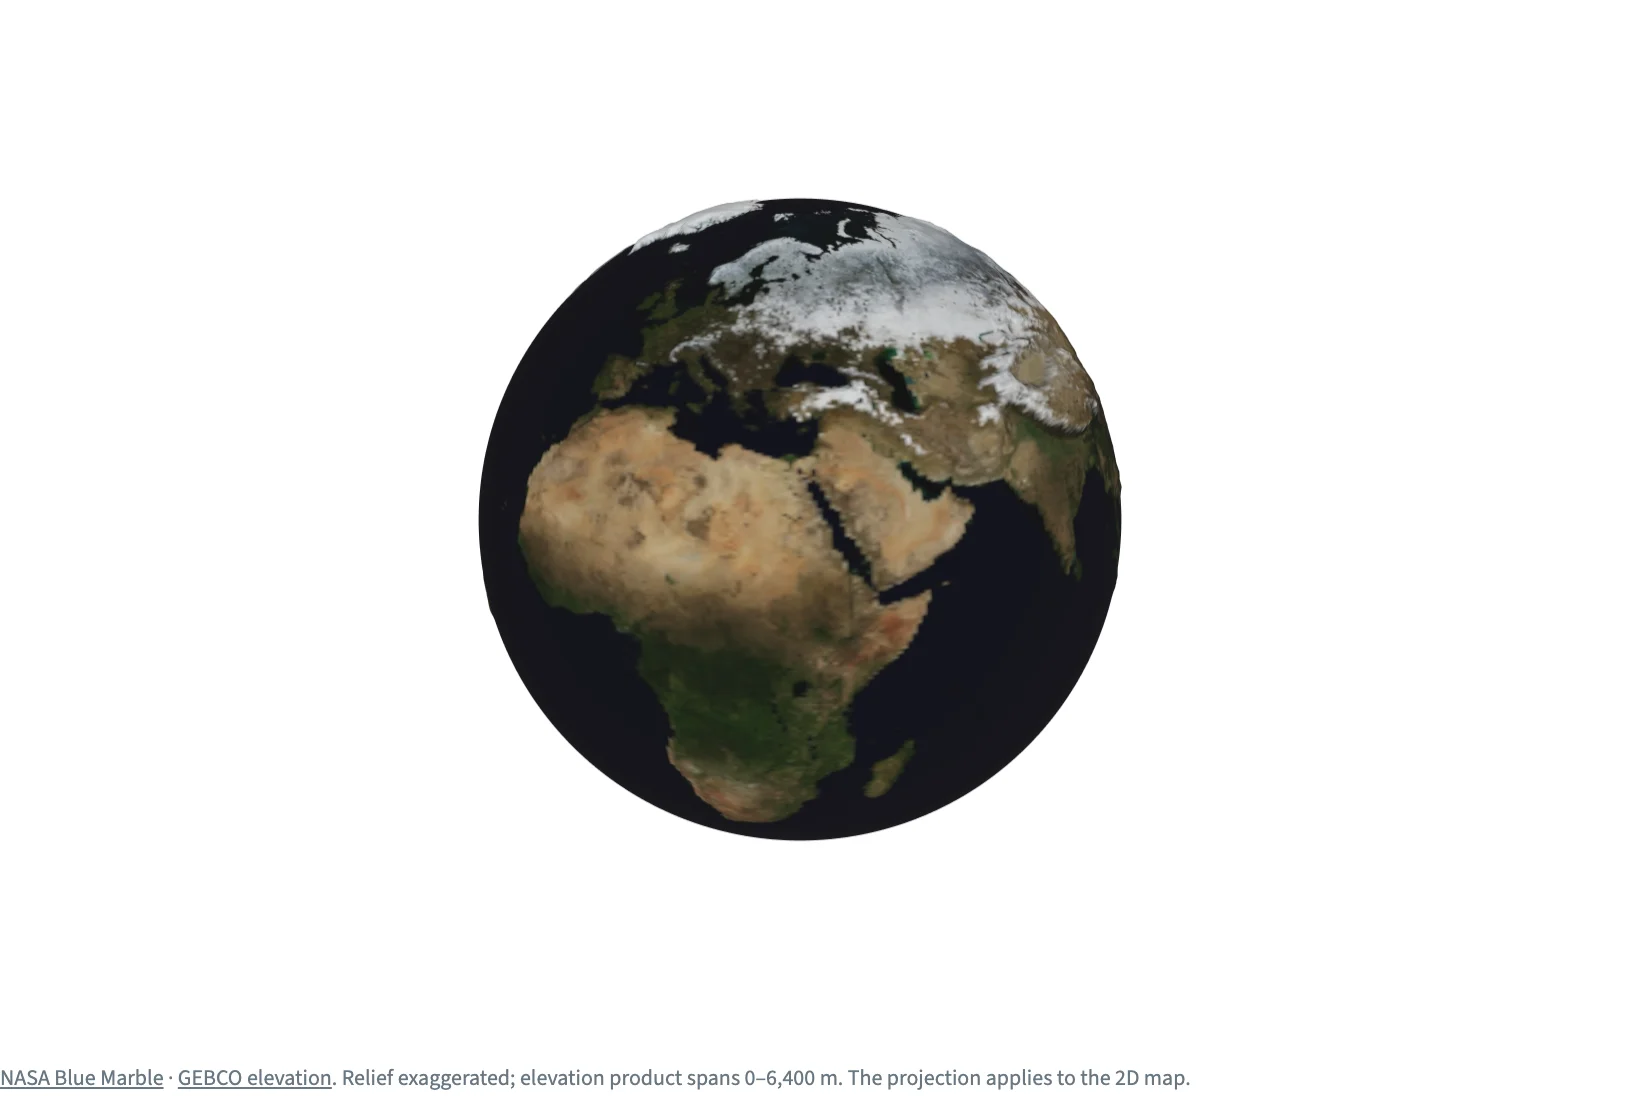
Static preview; loading the interactive plot
<script>
  import { onMount } from "svelte";
  import { InputContext, Select, Slider, Checkbox, Plot, Heatmap, Image, continuous } from "hmplot";
  import color from "./color.jpg";
  import elevationFile from "./elevation.png";

  // NASA's Blue Marble over an elevation surface on a globe (or a map). The browser decodes the
  // color image from its JPEG file; the elevation is a 512 x 256 grid of 0 (sea level) to 1
  // (6,400 m), south row first as a heatmap's rows run.
  let elevation = $state.raw();
  onMount(async () => {
    const bitmap = await createImageBitmap(await (await fetch(elevationFile)).blob());
    const { width, height } = bitmap, canvas = new OffscreenCanvas(width, height), context = canvas.getContext("2d");
    context.drawImage(bitmap, 0, 0);
    const pixels = context.getImageData(0, 0, width, height).data;
    elevation = Array.from({ length: height }, (_, row) =>
      Array.from({ length: width }, (_, x) => pixels[((height - 1 - row) * width + x) * 4] / 255));
  });
  // A Plot's type and projection, the lights and the surface's relief and shading are props of
  // their own: the controls set them through these.
  let view = $state("3d-y-up"), relief = $state(50), lit = $state(true), projection = $state("equirectangular");
</script>

<InputContext>
  <div class="controls">
    <Select name="view" label="Earth view" options={{ "3D globe": "3d-y-up", "2D map": "2d" }} bind:value={view} />
    <Slider name="relief" label="Height scale" min={0} max={200} step={1} bind:value={relief} />
    <Checkbox name="lit" label="Lit mode" bind:value={lit} />
    <Select name="projection" label="Earth projection"
      options={{ Equirectangular: "equirectangular", Mercator: "mercator", "Equal area": "equal-area" }} bind:value={projection} />
  </div>
  {#if elevation}
    <Plot type={view} coordinates="spherical" {projection} baseRadius={1} x={{ domain: [-180, 180] }} y={{ domain: [-90, 90] }}
      height={520} overview toneMapping={0} name="Earth"
      lights={[{ kind: "ambient", intensity: lit ? 0.35 : 0 }, { kind: "directional", position: [3, 2, 4], intensity: lit ? 2 : 0 }]}>
      <!-- Lit mode: the sun from the upper right; off, the image's own colors. -->
      <!-- The relief in globe radii: 6,400 m of Earth's 6,371 km, times the Height scale slider. -->
      <Heatmap fill={elevation} name="Elevation" zScale={(relief * 6400) / 6371000} surfaceMode lit={lit && view === "3d-y-up"}
        detail={256} fillScale={continuous({ domain: [0, 1] })} zrange={[0, 0]} textureResolution={[4096, 2048]}>
        <Image data={color} name="Blue Marble" zrange={[0, 0]} />
      </Heatmap>
    </Plot>
  {/if}
  <p class="credit"><a href="https://science.nasa.gov/earth/earth-observatory/blue-marble-next-generation/base-topography/">NASA Blue Marble</a> · <a href="https://science.nasa.gov/earth/earth-observatory/blue-marble-next-generation/topography-bathymetry-maps/">GEBCO elevation</a>. Relief exaggerated; elevation product spans 0–6,400 m. The projection applies to the 2D map.</p>
</InputContext>

<style>
  /* Python's Scene(gap=12), Row(wrap=True, min_width=0) and Markdown(font_size=11, color="#687782"). */
  .controls { display: flex; flex-wrap: wrap; align-items: center; gap: 16px; margin-bottom: 12px; }
  .credit { font-size: 11px; color: #687782; margin-top: 12px; }
  .credit a { color: inherit; }
</style>