Coordinated interaction dashboard
Hover either shared view: the same row enlarges in both. Click/Shift-click selects/toggles; Shift-drag brushes. Drag the brush or click away to clear it. The filtered view updates while brushing. The independent table must not react, even though its IDs and values match.
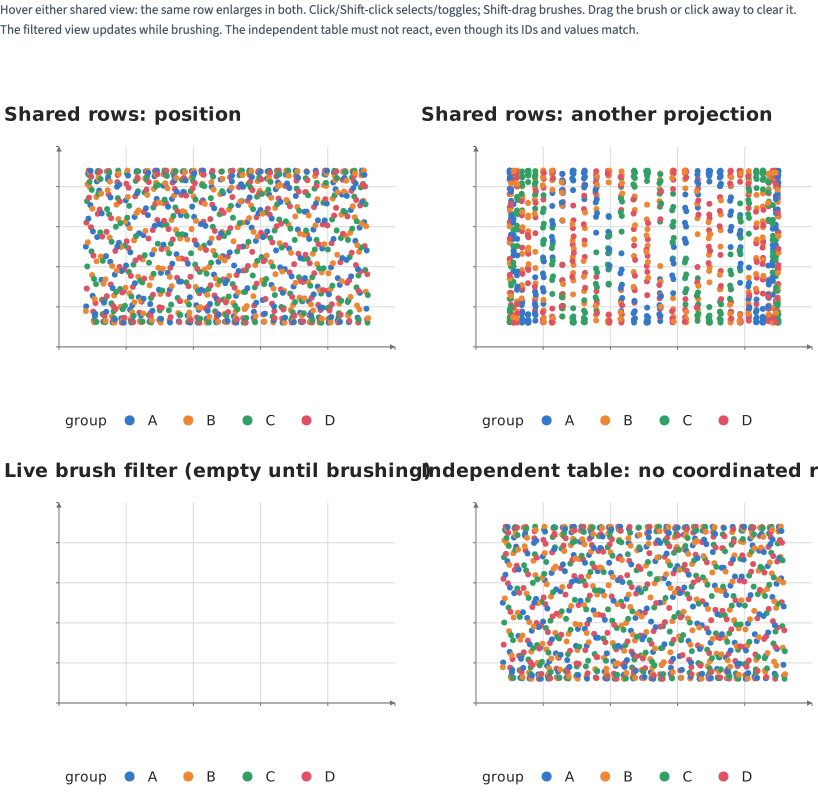
Static preview; loading the interactive plot
<script>
  import { InputContext, Select, Data, Filter, Plot, Points, Text, input, col, less, where } from "hmplot";

  // 1,024 rows in four groups, placed by four features; Rows shows the first 256 or all of them.
  // Three views share one keyed table, so hovering, selecting and brushing a row in one shows in
  // the others; the fourth reads an identical copy of the table, which shares nothing with them.
  const n = Array.from({ length: 1024 }, (_, i) => i);
  const records = {
    id: n.map((i) => `row-${i}`),
    n,
    group: n.map((i) => ["A", "B", "C", "D"][i % 4]),
    x: n.map((i) => 0.08 + 0.84 * ((i * 37) % 997) / 996),
    y: n.map((i) => 0.5 + 0.38 * Math.sin(i * 0.71)),
    score: n.map((i) => 0.5 + 0.4 * Math.cos(i * 0.29)),
    response: n.map((i) => 0.5 + 0.38 * Math.sin(i * 0.17 + 1)),
  };
  const independent = { ...records };
  const unit = { domain: [0, 1] };
  const size = where("@hovered", 11, 6);
  const shown = less(col.n, input.rows);
</script>

<InputContext>
  <p>Hover either shared view: the same row enlarges in both. Click/Shift-click selects/toggles; Shift-drag brushes. Drag the brush or click away to clear it. The filtered view updates while brushing. The independent table must not react, even though its IDs and values match.</p>
  <Select name="rows" label="Rows" options={{ "256": 256, "1,024": 1024 }} value={1024} />
  <div class="plots">
    <Data value={records} key="id">
      <Filter where={shown}>
        <Plot title="Shared rows: position" height={340} axes2d x={unit} y={unit}>
          <Points x="x" y="y" fill="group" {size} hover select brush respond={["hovered", "selected", "brushed"]} />
          <Filter where="@hovered" inactive="none">
            <Text x="x" y="y" text="id" size={12} dy={-16} />
          </Filter>
        </Plot>
        <Plot title="Shared rows: another projection" height={340} axes2d x={unit} y={unit}>
          <Points x="score" y="response" fill="group" {size} hover select brush respond={["hovered", "selected", "brushed"]} />
        </Plot>
        <Plot title="Live brush filter (empty until brushing)" height={340} axes2d x={unit} y={unit}>
          <Filter where="@brushed" inactive="none">
            <Points x="x" y="score" fill="group" {size} respond="hovered" />
          </Filter>
        </Plot>
      </Filter>
    </Data>
    <Plot data={independent} key="id" title="Independent table: no coordinated response" height={340} axes2d x={unit} y={unit}>
      <Filter where={shown}>
        <Points x="x" y="y" fill="group" {size} hover select />
      </Filter>
    </Plot>
  </div>
</InputContext>

<style>
  /* Python's Row(wrap=True, min_width=320, gap=16): two columns while each can be 320 px wide. */
  .plots { display: flex; flex-wrap: wrap; gap: 16px; margin-top: 12px; }
  .plots > :global(*) { flex: 1 1 320px; min-width: 0; }
</style>