HMPlot

Scatterplot matrix

Facet pairs: lazy pair views, one domain per field on x and y, and consistent category colors.
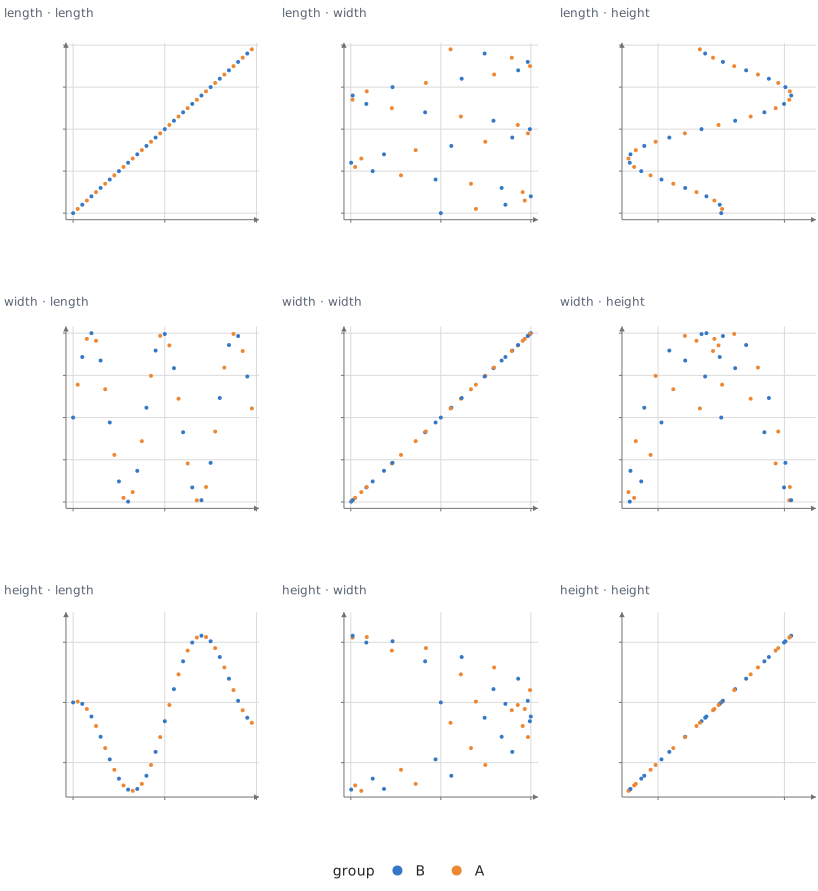
Scatter plot of length against length, colored by group (B, A). x from 0 to 4, y from 0 to 4. 40 points. Scatter plot of length against width, colored by group (B, A). x from -1 to 1, y from 0 to 4. 40 points. Scatter plot of length against height, colored by group (B, A). x from -1 to 3, y from 0 to 4. 40 points. Scatter plot of width against length, colored by group (B, A). x from 0 to 4, y from -1.1 to 1.1. 40 points. Scatter plot of width against width, colored by group (B, A). x from -1 to 1, y from -1.1 to 1.1. 40 points. Scatter plot of width against height, colored by group (B, A). x from -1 to 3, y from -1.1 to 1.1. 40 points. Scatter plot of height against length, colored by group (B, A). x from 0 to 4, y from -1 to 3. 40 points. Scatter plot of height against width, colored by group (B, A). x from -1 to 1, y from -1 to 3. 40 points. Scatter plot of height against height, colored by group (B, A). x from -1 to 3, y from -1 to 3. 40 points.

Static preview; loading the interactive plot

<script>
  import { Data, Facet, Plot, Points } from "hmplot";

  // 40 observations of three measurements in two groups. Facet pairs draws every pair of fields
  // (cells mount as they come into view), with one domain per field on x and y; Shift-drag in a
  // cell to brush its two fields, and the brushed rows stay lit in every cell.
  const data = Array.from({ length: 40 }, (_, i) => ({
    length: i / 10,
    width: Math.sin(i * 0.4),
    height: Math.cos(i * 0.23) + i * 0.04,
    group: i % 2 ? "A" : "B",
  }));
</script>

<Data value={data}>
  <Facet pairs={["length", "width", "height"]} link="grid">
    <Plot height={240} axes2d>
      <Points x="x" y="y" fill="group" size={4} brush respond="brushed" />
    </Plot>
  </Facet>
</Data>