HMPlot

Plot

A chart: axes, a camera and the marks inside it, in 2D or 3D.
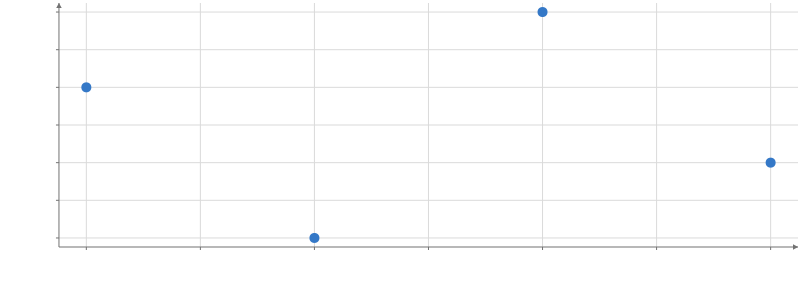
Scatter plot of y against x. x from 0.9 to 4.1, y from 0.9 to 4.1. 4 points.

Static preview; loading the interactive plot

import hmplot as hm

data = {"x": [1, 2, 3, 4], "y": [3, 1, 4, 2]}
with hm.Plot(data=data, height=300, axes2d=True) as plot:
    hm.Points(x="x", y="y")
plot

Options

Keywords are snake_case.

Options

animation_groupcolumn | column[] | null
Match animation rows by these columns within each filtered/transformed snapshot; selections keep Data.key. null restores key/position matching. Default: inherited; otherwise Data.key, then position.
descriptionstring
Your description of the plot for screen readers and exports; the generated summary of its marks, axes and legend follows it unless describe is false.
describeboolean
Add the generated summary of the plot's marks, axes and legend to its description. Default: True.
tooltipboolean | field[] | object
The tooltip of every mark in the plot that sets none: true, a list of fields, or {fields, radius, content, mode}. mode "x" lists every series' value at the pointer's x in one box.
nearestboolean | selection | object
The nearest of every mark in the plot that has rows and sets none: true, a selection(), or {selection, radius}.
loading"atomic" | "progressive"
"atomic" shows the plot once its first frame is complete; "progressive" draws each mark as soon as it is ready. Default: "atomic".
backgroundcolor
The plot's background: a CSS color, or "transparent". Default: the theme's (white in the default theme).
datatable
A table or live pipeline output for the marks in the plot; the same as wrapping them in Data.
schemaobject
Column types for data, such as {"day": "datetime"}, as on Data.
keycolumn | column[]
The column, or columns, that identify each row of data across updates, as on Data.
x{domain, transform, label, ...}
The x axis: its domain, transform, label, ticks, grid and the rest of an axis definition.
y{domain, transform, label, ...}
The y axis, as x.
z{domain, transform, label, ...}
The z axis of a 3D plot, as x.
scale_defaults{color, size, width}
Defaults for the continuous color, size and width scales the plot's marks make for numeric columns: each {colormap, range, transform, ...}.
z_scalenumber
The height scale of every surface in the plot (a Heatmap with surface_mode), unless the surface sets its own. Default: each surface's own (0).
legendboolean | {position}
true shows a legend that explains everything the plot's marks map from data (a guide per channel, as a Legend without a channel does), then lists the labeled marks; {position} puts it at the "top", "right", "bottom" (the default) or "left"; false shows none. A channel an explicit Legend explains is left out. Default: a legend at the bottom for each fill, color or outline color mapped from a category column.
coordinates"cartesian" | "polar" | "spherical"
The coordinate system: polar reads x as angle and y as radius; spherical reads x and y as longitude and latitude. Default: "cartesian".
polar_axis"X" | "Y" | "Z"
The axis a 3D polar plot turns around; a 2D polar plot uses "Z". Default: "Z".
spherical_view"globe" | "projected"
How a 3D spherical plot shows the sphere: as a globe, or flat in its map projection. Default: "globe".
camera_mode"orbit" | "flyover"
How the viewer moves a 3D camera: "orbit" turns around a target; "flyover" moves like a map (drag pans the ground, the wheel zooms toward the pointer, right-drag looks, WASD and QE fly). Default: "orbit".
camera_position[number, number, number]
Where the 3D camera is; the plot's box spans -50 to 50. A new value moves it there (easing with animation). Default: [90, 70, 140], scaled to the scene. In world units.
camera_target[number, number, number]
The point the 3D camera looks at. Default: [0, 0, 0] world units.
camera_up[number, number, number]
The 3D camera's up direction, overriding the view preset. Default: [0, 0, 1] for 3d; [0, 1, 0] for 3d-y-up.
camera_fovnumber
The 3D camera's vertical field of view. Default: 50 degrees.
camera_nearnumber
The 3D camera's near clipping distance. Default: from the scene's size. In world units.
camera_farnumber
The 3D camera's far clipping distance. Default: from the scene's size. In world units.
fly_speednumber
A multiplier on flyover's wheel zoom and key travel, from 0.1 to 10. Default: 1.
flyover_momentumboolean
A flyover ground drag released while moving glides on for a moment, slowing to a stop; false stops the view on release, as reduced motion does. Default: True.
lightsLightSpec[]
Lights for lit marks: ambient, directional, hemisphere or point. Positions use world units; omitted, no lights are added.
effectsEffectSpec[]
Effects over the whole plot: {kind: "sky", ...} (a 3D plot's sky), {kind: "bloom", strength, radius} (how glowing marks bloom), {kind: "fog", near, far, color} (a 3D plot's distance fog) or a registered plugin's kind with its parameters. A kind no plugin registers is skipped with a warning. SVG and PDF exports draw the whole plot as an image while one shows.
globe_backgroundcolor | false
A color fills the sphere under a 3D globe's marks; false leaves it empty. Default: False.
angle_unit"degrees" | "radians" | "extent" | "custom"
The unit of polar and spherical angles: "extent" makes the x domain one turn, "custom" uses angle_period. Default: "degrees".
angle_periodnumber
Angle units in one turn when angle_unit is "custom" (24 for hours). Default: 360.
base_radiusnumber
The radius at zero: a polar plot's radius is base_radius + radial_scale × y, a globe's base_radius + radial_scale × height. Default: 0 in polar coordinates, 1 in spherical.
radial_scalenumber
The radius per unit of y in a polar plot, or of height on a globe (see base_radius). Default: 1.
projection"equirectangular" | "mercator" | "equal-area" | "orthographic" | "equal-earth" | "natural-earth" | "albers" | "albers-usa"
The map projection of a 2D spherical plot (or a projected 3D one). An orthographic globe drags to turn; equal-earth, natural-earth, albers and albers-usa have curved outlines and draw a graticule instead of edge axes. Default: "equirectangular".
projection_center[number, number]
The map's center [longitude, latitude], in angle_unit: the orthographic globe's starting view, and the central meridian of equal-earth, natural-earth and albers (its origin latitude too). Default: [0, 0].
parallels[number, number]
The albers projection's two standard parallels, in angle_unit. Default: [29.5, 45.5].
subdivision_tolerancenumber
How far a curved line, band or outline may stray from its true shape before it is divided further. Default: 0.5 px.
zoom_axis"x" | "xy" | "y"
Which axes the viewer's 2D zoom changes. Default: "xy".
dynamic_marginsboolean
Fit axis margins during navigation. False fits initially, then holds this plot's own margins during pan/zoom; size, font, style and data-domain changes refit. Aligned peers can still reserve space; longer labels may clip. Default: True.
axis_margin_zoomboolean
With axes shown, zooming over an axis's margin zooms that axis only. Default: True.
overview_scalenumber
A multiplier on the marks' sizes in the overview. Default: 0.35.
overview_max_instancesnumber | null
The most rows per mark the overview draws; past it the rows are sampled (null draws them all). Default: 1000.
axis_frameboolean
Draw a complete rectangular border in 2D Cartesian frames without duplicate ticks or labels. Default: the theme's.
axis_maskboolean
Clip marks and picking to the rectangular 2D Cartesian axes interior, intersecting ancestor masks. Default: the theme's.
axes3dboolean | {style, gridPlanes}
Enable Cartesian 3D guides: true uses theme defaults; an object selects box or triad style and xy/xz/yz grid planes. Default: False.
aspect"auto" | "equal"
"equal" keeps one transformed data unit the same length on all Cartesian axes, including 3D; "auto" fills the plot. In 2D an explicit domain is kept: the plot area letterboxes instead of widening it. Polar and spherical plots are always equal. Default: "auto".
overview_axesboolean | {x, y}
Label the overview's axes: true for both, or {x, y} to choose. Default: False.
rules{axis, value, label, color, width, dash}[]
Reference lines across the plot at x or y values, each with an optional label, color, width and dash.
bands{axis, from, to, label, color, opacity}[]
Shaded spans of the x or y axis behind the marks and grid lines, labelled like rules.
viewport{x, y, zoom, zoomX, zoomY, center}
The 2D view: its center as a fraction of each axis's domain (x, y) and its zoom. With onviewportchange it controls the view or shares it between plots; with animation, a new value eases there.
interactiveboolean | "brush"
Let the viewer pan and zoom a 2D plot or move a 3D camera, and Shift-drag to brush a mark with brush; false fixes the view, and a plain drag brushes. "brush": a plain drag brushes, Shift-drag pans and the wheel zooms. Default: True.
namestring
The plot's name in its settings and export panels, and its accessible name when it has no title. Default: Plot 1, Plot 2, ....
widthnumber
A fixed width; without one the plot fills its notebook cell or exported page (in a Facet, its cell). hm.export_png, export_svg and export_pdf, with no page to fill, draw it 800 px wide; a view's own export draws it as shown. Default: the container width. In px.
heightnumber
The height of the whole plot: its title, caption and top or bottom legends take their room from it, and the drawing area the rest (at least a quarter of it). Default: 450 px.
responsiveboolean
True fills the container even when width is set; false uses width or 800 px. Default: fill the container without width.
type"2d" | "3d" | "3d-y-up"
A 2D plot, a Z-up 3D plot (3d), or a Y-up 3D plot (3d-y-up); camera_up overrides either 3D preset; SVG and PDF exports draw a 3D plot's 2D marks as vectors sorted by depth, and its marks as one image when one has no vector form there (a 3D mark, a Heatmap). Default: "2d".
settings{showTrigger, showExport, menu, allowSharedDefaults}
showTrigger: false hides the settings and export buttons; showExport: false hides the export button and the menu's Export entry; menu: false leaves the browser's own context menu instead of the plot's; allowSharedDefaults: false leaves the shared defaults out of the settings pane. The plot's export and openSettings() methods work whatever these say.
tone_mappingnumber
The three.js tone mapping the plot renders with: 0 (the default) keeps colors exact, so marks match their legends; 4 is ACES filmic, for a photographic look in lit 3D scenes. Default: 0.
overviewboolean
Show an overview in the corner: a minimap of the whole domain in 2D, an orientation gadget in 3D; exports leave it out. Default: False.
axes2dboolean
Draw the 2D axes: lines, ticks, labels and titles; on a 2D orthographic globe, a graticule (every 15°) and the sphere's outline. Default: true for 2D Cartesian plots and 2D orthographic globes; false otherwise.
orientation3dboolean
Show an X/Y/Z orientation indicator in the lower left while a 3D plot is hovered. Default: False.
axis_tick_labelsboolean
Draw the axes' tick labels. Default: True.
axis_titlesboolean
Draw the axis titles, in 2D and on the 3D box. Default: True.
antialias"msaa" | "ssaa8" | "ssaa16" | "smaa" | "off"
On-screen antialiasing: 4x MSAA (msaa), hybrid 8x/16x sampling (ssaa8/ssaa16: 4x MSAA at 2x/4x the pixel count, then downsampling), SMAA, or off. Hybrid modes cost more GPU work. Exports always use 4x MSAA at their requested resolution. Default: "msaa".
auto_boundsboolean
Fit missing x, y and z domains to the plotted data; an explicit domain always wins. Default: true when the plot has data (its own, an enclosing Data or a Facet); Python's Plot sends true.
animationboolean
Animate changes to the values of every mark in the plot (marks can set their own), and ease a new viewport or camera prop (position, target, up, fov, near, far) to its value, except under reduced motion; the viewer's press or wheel stops the move. Default: False.
animation_durationnumber
How long animated changes take, including setCamera's with animate. Default: 300 ms.
animation_easing"linear" | "quad-in" | "quad-out" | "quad-in-out" | "cubic-in" | "cubic-out" | "cubic-in-out" | "sine-in-out"
The easing of animated changes. Default: "cubic-in-out".
animate_boundsboolean
Animate numeric axis domains and ranges independently of mark animation; structural changes and direction reversals snap. Default: False.
bounds_durationnumber
Duration of scale transitions, independent of mark timing. Default: 300 ms.
bounds_easing"linear" | "quad-in" | "quad-out" | "quad-in-out" | "cubic-in" | "cubic-out" | "cubic-in-out" | "sine-in-out"
Easing of scale transitions, independent of mark timing. Default: "cubic-in-out".
titlestring
A title above the plot, part of it on screen and in its exports.
subtitlestring
A line under the title, smaller and lighter.
captionstring
A note under the plot, such as its source, smaller and lighter.
filenamestring
Save an export to this file when the plot's with block closes; the suffix picks PNG, SVG, PDF or HTML.
export_optionsobject
Options for that export, such as scale for PNG or mode and width for SVG and PDF; needs filename.

Map paths

interpolation"great-circle" | "angular" | "cartesian"
How the plot's paths run between two points on a map or a globe: along a great circle, straight in longitude and latitude, or straight in space. Marks can set their own. Default: "great-circle".

Axis style

axis_font_sizenumbersetting
The size of the axis labels. Default: the theme's (14 in the default theme). In px.
axis_font_familystringsetting
The axis labels' font, a CSS font-family. Default: the theme's.
axis_line_widthnumbersetting
The width of the axis lines and ticks. Default: the theme's (1 in the default theme). In px.
axis_tick_sizenumbersetting
The length of the ticks. Default: the theme's (3 in the default theme). In px.
axis_margin_leftnumber | "auto"setting
The space left of the plot area: "auto" fits the y axis's labels and title, a number pins it. Default: "auto". In px.
axis_margin_rightnumber | "auto"setting
The space right of the plot area: "auto" fits what reaches past it (the last x label), a number pins it. Default: "auto". In px.
axis_margin_topnumber | "auto"setting
The space above the plot area: "auto" fits what reaches past it (the top y label), a number pins it. Default: "auto". In px.
axis_margin_bottomnumber | "auto"setting
The space below the plot area: "auto" fits the x axis's labels and title, a number pins it. Default: "auto". In px.

Usage

Use Plot for ordinary charts. data supplies a local table; x/y/z configure the implicit frame. Defaults include a white background and atomic initial loading. Handles expose Fit, settlement, settings, selections, and export.

animateBounds={true} animates numeric axis domains and ranges independently of mark updates, using boundsDuration and boundsEasing. Mark animation keeps its separate animation, animationDuration, and animationEasing controls. They share one clock; see Frame animated scales for interruptions, exports, and changes that snap.

Axis titles default to the plotted column: an axis is named after the one column its marks plot there (x={{label}} and y={{label}} override it, and an empty label means automatic); an axis whose marks plot several columns, arrays or expressions has no title (see Frame axis titles).

axes2d shows the implicit frame’s 2D axes (on by default for Cartesian 2D). Given explicitly, it holds whatever the Plot contains. Without it, a child Frame that draws an axis on the plot’s side (a twin axis with no range) turns the axes on; ranged or anchored Frames and facet cells, and Frames inside them, draw their axes in their own boxes and never do.

dynamicMargins={false} (Python: dynamic_margins=False) fits the initial axis labels, then holds this plot’s own margins during pan and zoom, including after a gesture ends. Resize, font, axis-style/title and data-domain changes fit again. Longer navigation labels may clip; use a shorter axis format or numeric Theme.axes.marginLeft/marginRight/marginTop/marginBottom to reserve predictable space. Aligned plots still share the space their peers need, so this option does not lock the entire plot rectangle against changes elsewhere. The settings pane exposes Fit margins during navigation. The default remains true. axisMarginZoom separately controls axis-only zoom gestures in the margins.

type="3d" uses Z-up, so an x/y terrain grid rises along z. Use type="3d-y-up" for scenes whose height is y. cameraUp overrides either preset (Python: camera_up); the settings pane offers both presets. Switching the preset changes the up direction without remapping data coordinates.

In 3D, cameraMode chooses orbit or flyover navigation (flyover is map-style: a drag keeps the ground point under the cursor, the wheel zooms toward the cursor, right-drag or Alt-drag looks, WASD/QE fly, two fingers pinch toward their midpoint on touch, flySpeed and Shift scale the wheel and keys). cameraPosition, cameraTarget, cameraUp, and cameraFov set the camera; the handle’s getCamera(), setCamera(partial, {animate}), and fit() move it programmatically, and oncamerachange reports moves.

flyoverMomentum (default true; “Flyover momentum” in the settings pane) lets a flyover ground drag released while still moving glide on along the ground for a moment, slowing to a stop within about a second and a half and at most one and a half camera heights away, with the camera’s height and direction kept. A drag held still before release does not glide, and only ground drags do (not looking, pinching, the wheel or the keys). Any new input (a press, the wheel, a key, Escape), leaving the page, a programmatic camera change and disabling the controls stop a glide; whenSettled() and exports wait for it to stop. flyoverMomentum={false}, and the system’s reduced-motion setting, stop the view on release.

lights lists the lights used by marks with lit=true: ambient, directional, hemisphere and point. The settings pane edits their color, intensity and position. Python uses lights=[hm.light("ambient", intensity=0.3)]; Svelte uses lights={[light("ambient", { intensity: 0.3 })]}.

effects composites effects over the whole plot: a 3D plot’s sky ({ kind: "sky", image } or a gradient) and distance fog ({ kind: "fog", near: 100, far: 300 }, distances from the camera in world units; the plot’s box spans -50 to 50), how glowing marks bloom ({ kind: "bloom", strength, radius }), and plugins’ effects. They are drawn after the scene (docs/RENDERING.md “Sky, fog and glow”): picking ignores them, empty background stays clear, and marks that do not write depth, such as labels, take the fog of what is behind them. The settings pane shows fog with the camera settings (3D fog, start, end and color), and bloom’s strength and radius.

antialias chooses how the screen smooths edges: "msaa" (4x multisampling, the default), "ssaa8" or "ssaa16" (hybrid MSAA + supersampling), "smaa" (a post pass: faster when fills are heavy, softer thin lines) or "off". The hybrid modes render 2x/4x as many pixels with native 4x MSAA, then downsample through the presentation compositor: nominal 8x/16x sampling density at greater GPU and memory cost. They preserve CSS mark sizes and picking coordinates. WebGPU’s native MSAA is limited to 4x. Points, lines and text smooth their own edges in every mode, and so do 2D Rects, Bars, Histograms and BoxPlot boxes without MSAA (docs/RENDERING.md “Analytic edges”); other fills (Area, Pie and polar sectors, hexagons, GeoJSON, 3D) need MSAA for smooth edges. Exports always render with 4x MSAA at the requested export resolution, whatever the screen uses. Python uses the same values: hm.Plot(antialias="ssaa16").

Default size and axes

Without dimensions, a Plot fits its container up to 800 px wide, and is 450 px tall; its title, caption and top or bottom legends take their room from that height. In a Python notebook view or an exported HTML page it fills the cell or page instead; hm.export_png, export_svg and export_pdf, with no page to fill, draw it 800 px wide. Set width and height for fixed dimensions; set responsive={true} (Python: responsive=True) for uncapped container width, including when a width is supplied. responsive={false} uses the supplied width or 800 px. Facet cells continue to fill their allocated space.

Axes and grids are visible by default only in 2D Cartesian plots. Polar, spherical and 3D plots keep them off unless requested. Use axes2d={false} or axes3d={false} (Python: axes2d=False, axes3d=False) to hide them. For 2D Cartesian plots, the default theme draws subtle major grids; minor grids remain off. Set x={{ grid: "off" }} and y={{ grid: "off" }} to hide the grids, or choose another theme.

Cartesian proportions and 3D guides

aspect="equal" makes equal transformed data units equally long on every Cartesian axis, including 3D. Linear axes preserve ordinary data proportions; log/symlog axes preserve proportions after their scale transform. User domains, range centers and reversed directions are retained: in 2D the spare length goes to an axis whose domain is automatic, which shows more than its data, and where it would fall on a domain you gave, the plot area narrows (letterboxes) so that domain fills it exactly, leaving at most 45% of the plot on a side. Nested Frames share the root metric; explicit nested placements remain placements. Changing domains or aspect updates the geometry without resetting camera orientation. Polar and spherical geometry retains its natural proportions.

<Plot type="3d" aspect="equal" axes3d={{ style: "box", gridPlanes: ["xy", "xz"] }}>

axes3d defaults to false. True uses theme.axes.threeD; an object enables guides with its overrides. A box shows every edge; a triad shows three incident axes. Labels use near-facing edges, stay upright and avoid duplicate shared-corner labels; selected grid planes occupy far faces as the camera moves. Per-axis controls style baselines, ticks, titles, arrows and grids. Explicit box/triad objects require Cartesian coordinates.

Borders and data masks

axisFrame={true} adds the missing sides of a rectangular Cartesian 2D border, without opposite-side ticks or labels. axisMask clips points, thick lines, fills and data text to the visible axes interior. Hidden fragments cannot be picked. Nested masks intersect with ancestor masks; facet cells are supported. Axis guides, titles, legends and brush handles remain visible. Masks work with hidden baselines and transparent backgrounds, and SVG/PDF exports use the same boundaries as PNG and the screen.

HMPlot enables masks by default; Minimal leaves them off. A theme’s mask is ignored outside supported Cartesian 2D frames; an explicit unsupported request raises an error. Python spells the options axis_frame and axis_mask.

Cartesian 2D rules draw above marks, using the theme’s axis text color unless a rule supplies its own color. Grid lines and shaded bands stay behind marks. Rule width, dash and color apply consistently to the canvas and vector exports.

animationGroup (animation_group in Python) on Data, Plot or Frame matches animated rows by a column or list of columns independently of Data keys. It inherits through the tree; a child Frame overrides its branch, and explicit null (Python None) restores Data-key/position matching. Filter to one row per group before tweening: a country/year table can keep key=["country", "year"] and animate by "country" after filtering to one year. Groups must be unique in each tweened snapshot, and changing the group column scheme resets motion history. Selection, hover and connections keep Data identity.

Related examples

Data shortcuts