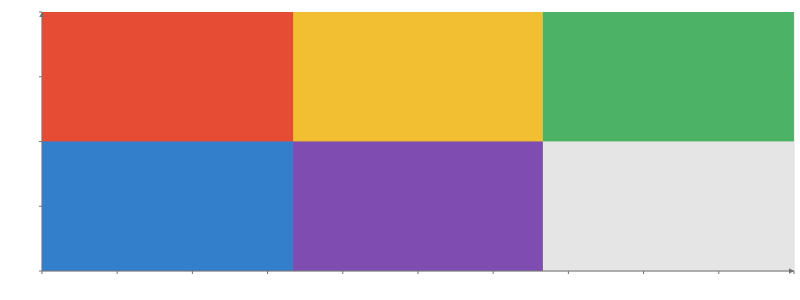
An image drawn from its pixels: grayscale, RGB or RGBA.
Static preview
Static preview; loading the interactive plot
import hmplot as hm# Two rows of three RGB pixels, 0 to 1.pixels = [ [[0.9, 0.3, 0.2], [0.95, 0.75, 0.2], [0.3, 0.7, 0.4]], [[0.2, 0.5, 0.8], [0.5, 0.3, 0.7], [0.9, 0.9, 0.9]],]with hm.Plot(height=300) as plot: hm.Image(data=pixels, pixelated=True)plot
Options
Keywords are snake_case.
Options
datanumber[][] | number[][][] | url | image
The pixels, row 0 at the top: [height, width] (grayscale) or [height, width, 3 or 4] (RGB, RGBA), integers 0-255 or floats 0-1. Or an image file, which the browser decodes (RGB, or RGBA when some pixel is not opaque): a URL; in Python also a path, bytes or a PIL image; in JavaScript also a Blob, an ImageBitmap, or an image or canvas element.
pixelatedboolean
Draw each pixel as a sharp square instead of blending it into its neighbors. Default: False.
litboolean
Shade the image with the plot's lights instead of showing its exact colors. Default: False.
Position
xcolumn
Over a grid table, the dimension drawn along x. Default: the grid's last dimension.
ycolumn
Over a grid table, the dimension drawn along y. Default: the grid's second-to-last dimension.
zchannel
The z position, in a 3D plot: a column, per-row values, or one value.
Appearance
fillcolumn | {r, g, b, a}
Over a grid table, the pixels' colors instead of data: a column of [r, g, b] or [r, g, b, a] rows, or {r, g, b, a} naming a column per channel. Integers are 0-255, floats 0-1.
opacitychannel
The opacity, 0 to 1: a number, or a column (categories map through opacity_scale). Default: 1.
Scales
fill_scalescale
The fill's scale, which marks can share: continuous({domain, colormap, transform}) for numbers, categorical({domain, range}) or ordinal() for categories.
colormapstring | color[] | object
The colormap of a numeric fill or color: a name, a list of colors, or {colors, space, positions}. Default: the theme's (Viridis).
opacity_scalescale
A categorical() scale from the opacity column's categories to opacities, 0 to 1.
Display
labelstring
The mark's name in the legend and the settings pane.
legendboolean
Whether the mark has a legend entry. Default: True.
visibleboolean
Whether the mark is drawn. Default: True.
domainsboolean
Whether the mark's data counts toward its axes' automatic domains; false leaves them to the other marks (a reference line, a decorative part). Default: True.
rows"auto"
"auto" draws one item when no channel reads a column (a line at a value, a label at a point), instead of one per row of the data; "@" view-state fields are not columns.
How the mark mixes with what is drawn under it; any mode but normal draws it transparent, and SVG and PDF exports draw additive and subtractive as an image. Default: "normal".
glownumber
How much the mark glows: its own color times glow blooms around it in the plot's presentation (0 does not glow); the Plot's bloom effect sets the bloom's strength and radius. SVG and PDF exports draw the whole plot as an image. Default: 0.
shadeShadeSpec
A plugin's shade (registerPlugin): { kind, ...parameters }, as { kind: "hatch", spacing: 6 } (Python hm.shade("hatch", spacing=6)), recolors each fragment the mark draws; picking, tooltips, domains and legends are unchanged. SVG and PDF exports draw a shaded mark as an image.
optionsstring[]
The settings the settings pane shows for this mark, by name.
namestring
The mark's name in the settings pane, and the name facet.endpoint() and partition.endpoint() find it by.
Interaction
identityidentity
Whose rows these are for selections: an identity() shared by tables that show the same things. Default: its data's.
selectboolean | selection | object
Click to replace the selection; an exact repeat clears it. Shift/Meta/Ctrl-click toggles membership (whole series for Line, Area): true uses its data's selection, or give a selection(). input("root").set("id") writes an input instead: a click sets it to the clicked row's id (a drill-down's root), .set(literal(v)) to a constant, .reset() to its default, and a click on nothing restores its default (input("root", {default}), else a Select of that name's, else null); several marks may write one input.
hoverboolean | selection | object
Mark the row under the pointer as @hovered (a whole series for Line, Area), without fading the others: true uses its data's hover, or give a selection(). input("focus").set("series") writes an input instead: while the pointer is on a row the input shows its series (or .set(literal(v)), a constant), then its committed value again (a hover that would change this mark's own rows is an error).
tooltipboolean | field[] | object
Show the nearest row's values in a box by the pointer: true, a list of fields, or {fields, radius, content}. Default: the Plot's.
Which interaction states fade this mark's other rows to selection_opacity; "hovered" fades them while hovering, "nearest" while a row is nearest. Default: the states it sets, except hover and nearest.
selection_opacitynumber
The opacity of the rows outside the selection while one is active. Default: 0.25.
enter_effectboolean | "fade" | object
How rows that arrive in a keyed update appear: "fade", or {effect, duration, easing}. animate()'s enter option is the value a channel starts from.
exit_effectboolean | "fade" | object
How rows that leave in a keyed update disappear, as enter_effect. animate()'s exit option is the value a channel ends at.
Animation
animationboolean
Animate changes to the mark's values. Default: False.
animation_durationnumber
How long an animated change takes. Default: 300 ms.
This mark's own z transform, instead of its frame's. Default: its frame's.
z_invertbooleansetting
Reverse this mark's z direction. Default: False.
zbounds[number, number]setting
The z extent this mark maps, instead of its frame's domain (an image's or a grid's extent). Default: its frame's.
zrange[number, number]setting
Where this mark's z extent lands, in its frame's world units. Default: its frame's.
Usage
Supply the image tensor through data. Preserve image dimensions and channel shape.
data may also be an image file, which the browser decodes once into RGB values (RGBA when some pixel is not opaque), so a 4096 × 2048 JPEG travels as its 1 MB file, not as 100 MB of numbers: in Svelte a URL, a Blob, an ImageBitmap, an <img> or a <canvas>; in Python a URL (http, https or data:, loaded by the browser), or a file path, bytes or a PIL image, sent encoded (a JPEG stays a JPEG), as the sky effect’s image is. The plot waits for it (aria-busy and whenSettled()); a failed load is the plot’s error.
hm.Image(data="earth_daymap.jpg", lit=True)# a local file, decoded by the browser
Over a grid table (see Data, “Grid tables”) the colors are fill, as every mark’s RGB channel is: an [n, 3 or 4] column, or { r, g, b, a } naming columns (satellite bands: fill={{ r: "B04", g: "B03", b: "B02" }}), 0-255 integers or 0-1 floats, placed by the grid’s coordinates.
An image shows its exact colors. With lit it is shaded by the Plot’s lights instead, like other lit marks, so supply lights: a planet’s surface map in a spherical Frame, lit by a point light (Plot(lights=[hm.light("point", ...)])) at its sun, has a day side and a night side.