Theme
Fonts, colors and mark styles for everything inside it.
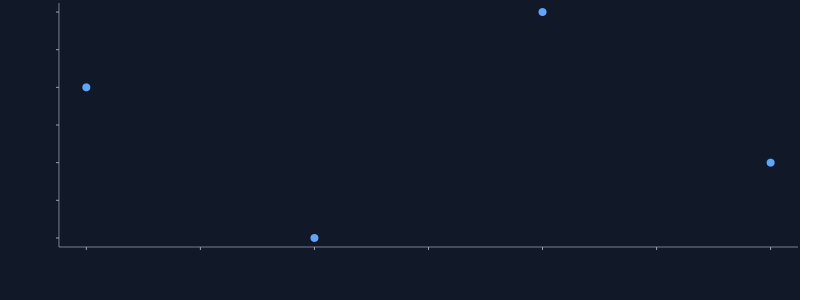
Static preview; loading the interactive plot
import hmplot as hm

data = {"x": [1, 2, 3, 4], "y": [3, 1, 4, 2]}
with hm.Theme(value=hm.themes.dark) as themed:
    with hm.Plot(data=data, height=300, axes2d=True):
        hm.Points(x="x", y="y")
themed
Usage
value is a theme definition or shared theme resource. Nested themes merge sections; palettes replace arrays. Explicit mark props and settings keep precedence. Themes do not change data or numerical transforms.
Inherit from a theme
A definition with extends starts from another theme and changes only what it names: extends is a preset name (matched ignoring case and punctuation, so "financeTerminal" and "finance-terminal" both work), a theme definition, or a theme resource. Its own keys deep-merge over the base: objects merge key by key, arrays (a palette) and values replace. Chains work; a cycle is an error.
const desk = createTheme({ extends: "financeTerminal", name: "Desk", palette: ["#00ff88", "#ffd166"] });
const night = createTheme({ extends: desk, axes: { grid: "major" } });
desk = hm.create_theme("Desk", extends="finance-terminal", palette=["#00ff88", "#ffd166"])
night = hm.create_theme(extends=desk, axes={"grid": "major"})update() cannot change extends; replace({ extends, ... }) rebases a theme.
Compose themes
extends can be a list, merged left to right, with the theme’s own keys last: a complete look first, then partial themes that each change one section.
const report = createTheme({ extends: ["paper", "axes/minimal", "legend/inline-top"], name: "Report" });report = hm.create_theme("Report", extends=["paper", "axes/minimal", "legend/inline-top"])The library ships these partial themes (names match ignoring case and punctuation in each part, so "legend/inlineTop" works too):
| Partial | Sets |
|---|---|
axes/minimal | no grid, baseline or arrows; short outside ticks |
axes/grid | major grid lines, no baseline, ticks or arrows |
axes/frame | a full border with inside ticks, no grid or arrows |
legend/inline-top, legend/inline-bottom | the Plot’s legend above or below, entries in a row |
legend/stacked-right | the Plot’s legend to the right, entries stacked |
title/left, title/centered | the title block’s alignment |
controls/compact, controls/large | inputs’ text size, 11 or 15 px |
numbers/currency, numbers/percent, numbers/si | numbers.format: "$,.0f", ".0%" or "~s" |
animation/fast, animation/slow | animated changes take 150 or 600 ms |
animation/linear | animated changes ease linearly |
animation/fade | keyed rows fade in and out |
title/editorial, title/panel, title/presentation | 24, 16 or 32 px title hierarchy with subtitle/caption sizes and spacing; alignment unchanged |
axes/quiet-grid, axes/print-frame | thin adaptive major grid, or stronger frame with inside ticks |
axes/inside-ticks, axes/light-titles | tick direction alone, or 400-weight axis titles |
axes/close-labels, axes/comfortable-labels | axis-title/tick-label offsets of 6/3 or 12/7 px |
legend/compact, legend/generous | 12/10 or 16/16 px text/swatch sizing |
legend/subdued-heading, legend/strong-heading | heading weight of 400 or 700 |
legend/mark-shapes | swatches follow the encoded mark shape |
marks/points-dense | 4 px points, 0.45 opacity, no outline |
marks/points-outlined, marks/points-open | 9 px points with a neutral outline; open also sets transparent fill |
marks/points-presentation | 14 px points with a thin neutral outline |
marks/lines-fine, marks/lines-medium, marks/lines-bold | Line widths of 1, 2 or 3 px |
marks/intervals-crisp | ErrorBars width 1.25 px, cap size 6 px |
marks/areas-subtle | Area opacity 0.15; does not imply a confidence level |
marks/bars-muted | Bar opacity 0.65 only; bin/category spacing unchanged |
A partial lends only its section, never its name: ["paper", "title/centered"] is still named Paper. A theme of your own is a partial when its name starts with one of the groups axes/, legend/ (the guides section), title/, controls/, numbers/, animation/ or marks/: { "name": "legend/house", "guides": { "position": "top" } }. It should set only that section; any other key warns and is ignored wherever the partial is used, in extends or as a nested Theme. A partial’s own extends takes only its section from each base, so { "name": "axes/paper", "extends": "paper" } is Paper’s axes alone.
The cascade is plain order, with no specificity: the themes in extends in list order, the theme’s own keys, then a nested Theme around part of the page (which changes only what it names), and last a mark’s own props. At every step objects merge key by key and lists (a palette, a dash pattern) replace.
marks/ partials merge only the named mark kinds. They preserve palettes, axes, annotations
and unrelated marks. The point outlines use neutral slate #64748b, readable against light
and dark backgrounds; set outlineColor explicitly to encode a category or choose another
stroke. Explicit fill and size channels win over point defaults, including transparent
fill. An open flat point’s transparent fill does not hide its solid 3D counterpart: that
counterpart uses the palette unless its own entry overrides it.
Bars and boxes
A Rect or Prism with no fill takes the theme’s first palette color, and so do Bar (its bars are Prisms) and Histogram (Rects): the color every preset makes stand out on its background (#3478c7 in the default theme). It is the weakest of the theme’s defaults: marks.default, an entry of the mark’s own (marks: { Rect: { fill: "#e45756" } }, which a Histogram’s bars take too; Bar and Histogram entries for them alone), the mark’s props and its Mapping all win.
Line, Points, Area, ErrorBars, Segments and Arrows also use the first
palette color when their theme entry has no color or fill. HMPlot and Ink use null for
these entries, so changing their palette updates ordinary marks too. A null color/fill
clears an inherited color; explicit colors and marks.default still take precedence.
In Python theme definitions, use None for null.
Title block
title styles the title block of every Plot and Facet below the theme: their title, subtitle and caption. align is "left" (the default), "center" or "right"; fontSize (default 1.35 times the theme’s text size), subtitleFontSize (one pixel larger than the text) and captionFontSize (one smaller) are CSS pixels; fontWeight is a whole number from 100 to 900 (default 600); spacing is the space between the block and the plot (default 8). PNG, SVG and PDF exports draw them as laid out: { "title": { "align": "center", "fontSize": 20 } }.
"inherit" as typography.fontFamily or typography.color takes the font or text color of the element the plot sits in, so an embedded chart matches its page: { "extends": "minimal", "typography": { "fontFamily": "inherit", "color": "inherit" } }. It is the whole theme’s text: the axes’, legends’, titles’ and Text marks’ fonts and colors, over the ones a preset sets. A section’s fontFamily or textColor (and a mark’s font or color) can be "inherit" on its own. In a notebook the font is the notebook’s and the color the plot frame’s, which keeps text readable on it; exported files and pages use a system sans-serif and dark gray. The host’s style is read when the plot mounts.
guides styles legends: fontFamily, fontSize and textColor are their text. position is where a Plot’s own legend sits, "bottom" (the default), "top", "left" or "right"; a Plot’s legend={{ position }} still wins, and a Facet’s grid legend and an explicit Legend keep their own defaults. layout is how entries flow: "auto" (the default) puts them in a row below or above the plot and stacks them beside it, "inline" and "stacked" always do one. swatchSize is a category or series swatch’s size in CSS pixels (default 12), and swatchShape is "auto" (the mark’s own shape, the default), "circle" or "square"; a line or text entry keeps its own, and size and opacity ramps keep theirs. titleFontSize (default the text size) and titleFontWeight (default 500) style the legend’s title: { "guides": { "position": "top", "layout": "inline", "swatchShape": "square" } }.
A page restyles the title block and legends with CSS custom properties, set on the plot or any element around it, over the theme: --hm-title-font, --hm-title-color, --hm-title-align, --hm-title-spacing, --hm-title-font-size, --hm-title-font-weight, --hm-subtitle-font-size and --hm-caption-font-size (the font, color and alignment are the whole block’s, caption included), and --hm-legend-font, --hm-legend-color, --hm-legend-font-size, --hm-legend-title-font-size and --hm-legend-title-font-weight. Sizes are CSS lengths (13px). The plot lays them out as the page shows them, and PNG, SVG and PDF exports from the page draw that layout, overrides included; Python’s exports, drawn in a page of their own, use the theme’s values. Text inside a legend’s graphics (colorbar ticks, size and opacity ramp labels, a text swatch) has a fixed 10 px font: it takes --hm-legend-color but not the font or size variables. Axes are drawn by the plot and keep the theme’s. The Title and Markdown marks do not read --hm-title-*. The variables inherit, as custom properties do, into nested plots and facets and win over a nested Theme; setting them again on an inner wrapper scopes them to it.
.report { --hm-title-font-size: 20px; --hm-title-align: center; --hm-legend-color: #475467; }Missing values
missing is the color a missing value (NaN or null) of a colormapped fill or color draws in under the theme, unless its scale sets one (continuous({ missing })); the default, #92989f, is a neutral gray that reads on light and dark backgrounds. A GeoJSON’s features without a value take it too, unless the GeoJSON sets missingColor.
Numbers
Without a format, numbers read as decimals: axis ticks exactly, colorbars to three significant digits, size ramps and tooltips to four (a whole number stays whole), with thousands grouped once a value reaches 10,000 (12,345, and 10,000 on a log axis rather than 1e+4). numbers.format is a d3-format string, the language of an axis’s format, that linear axes’ ticks, legends and tooltips use instead: ",.2f", ".1%", or currency with "$,.0f". An axis’s format, a mark’s legendTickFormat and a tooltip field’s format win over it; dates, durations, log axes and angles (a polar angle, a globe’s longitude and latitude) keep theirs.
money = hm.create_theme(extends="hmplot", numbers={"format": "$,.0f"})Animation
animation times animated changes under the theme: duration in milliseconds and easing ("linear", "quad-in", "quad-out", "quad-in-out", "cubic-in", "cubic-out", "cubic-in-out" or "sine-in-out") are every Plot’s animationDuration and animationEasing (300 and "cubic-in-out" without a theme), and enter and exit are every mark’s enterEffect and exitEffect: true or "fade", or { "effect": "fade", "duration": 200, "easing": "quad-out" }. A Plot’s or mark’s own props win. The section does not turn animation on: a Plot’s or mark’s animation does, and enter and exit reach only marks that animate and whose rows a keyed update stages (Points, Text, Rect, Prism, Segments, Arrows, ErrorBars and their 3D kinds). false cancels an enclosing theme’s effect: { "animation": { "duration": 600, "easing": "linear", "enter": "fade", "exit": "fade" } }.
Inputs
Sliders, Selects, Buttons, Checkboxes, Playbacks and the other inputs take their look from the theme around them (the default theme outside any Theme): the theme’s font (typography.fontFamily; "inherit" keeps the page’s), and a controls section. controls.accentColor colors a slider’s handle and fill, a checked box and the focus ring (default the theme’s first palette color); controls.fontSize is their text size in CSS pixels (default typography.fontSize), and the controls’ heights and spacing scale with it. Their text color is the page’s. Each shows its label first and the control after it (a checkbox’s label follows its box); a Slider or Playback shows its value beside it, to its numeric step’s decimals (step 0.001 writes 12.345), else as tooltips write numbers (four significant digits, 12,346), unless it sets format; the theme’s numbers.format is for data, not controls, and {$name} placeholders read the same text: { "controls": { "accentColor": "#0f766e", "fontSize": 13 } }.
A page restyles inputs with the same custom properties as the settings pane, over the theme: --hm-controls-accent, --hm-controls-font, --hm-controls-font-size, --hm-controls-color and --hm-controls-background (a field’s or button’s fill, transparent by default). Each input’s outer element has the class hm-input and one for its kind (hm-slider, hm-range-slider, hm-select, hm-multi-select, hm-button, hm-checkbox, hm-playback, hm-text-input, hm-color-picker, hm-date-time-input); its label is .hm-input-label and a slider’s value .hm-input-value.
.dashboard { --hm-controls-accent: #0f766e; --hm-controls-font-size: 12px; }
.dashboard .hm-input-label { font-weight: 600; }
3D marks
marks sets defaults by mark kind. A Points3D, Arrows3D or Text3D with no entry of its own takes only the color of its flat counterpart: the fill of Points, the color of Arrows and of Text, so a theme recolors 3D plots too (a dark theme’s light text reaches Text3D). Symbol names, pixel sizes and outlines stay with the flat marks. An entry such as marks: { Points3D: { fill: "#e45756" } } sets a 3D mark apart; a mark’s own props and its Mapping still win.
Basemap schemes
A theme’s vectorTile section is the color scheme VectorTile draws with below it: part → style, with the keys of VectorTile’s styles ({ "water": { "fill": "#1e3a5f" }, "buildings": false }). Every preset has one that matches it. A theme with colors of its own and no vectorTile section gets a scheme derived from its background, text color and palette. See docs/VECTOR-TILES.md.
Settings and export controls
A plot’s settings pane, export panel, buttons and context menu take its theme’s background and text color, so a dark theme gets dark controls; the rest of their colors are mixed from those two. A page restyles them with CSS custom properties, set on the plot or any element around it: --hm-controls-background, --hm-controls-color, --hm-controls-accent (selection, focus and the Download button) and --hm-controls-font.
.dashboard { --hm-controls-accent: #0f766e; --hm-controls-font: "Inter", sans-serif; }Edit themes as JSON
Built-in theme definitions live in src/lib/plot/themes/. Copy one JSON file, edit its presentation fields, and use createTheme(definition) in Svelte or hm.load_theme("my-theme.json") in Python. A JSON theme can also hold only its differences, with "extends": "dark". The accompanying theme.schema.json describes the accepted fields. Python packages include the built-in JSON files.
Axis titles and tick labels
Themes set axis title position, rotation, placement and spacing with axes.titlePosition (start, middle, end), titleAngle (auto or degrees), titlePlacement (inside, outside) and titleOffset (CSS pixels). Tick labels have tickLabelAngle, tickLabelAlign (auto, start, middle, end), tickLabelPlacement and tickLabelOffset.
These defaults apply to each axis; explicit Plot or Frame axis settings take precedence. auto title rotation follows the axis orientation.
readable = hm.create_theme(extends="hmplot", axes={
    "title_position": "middle", "title_placement": "outside",
    "title_offset": 10, "tick_label_offset": 5,
})
JSON and JavaScript use camelCase keys; Python accepts snake_case. The neutral presets use outside axis titles. Notebook and Observable use compact typography; Presentation enlarges ticks, legends, controls and marks as well as headings. Explicit props win.
HMPlot’s default look
The default preset, hmplot, pairs a white background and Source Sans 3 with a bright,
contrasting categorical palette: blue, orange, green, rose, violet, gold and cyan. Ordinary
lines use the first palette color. Solid 10 px points have no outlines; bold outside titles,
subtle major grids and small filled arrows provide readable axes. Cartesian data is masked
at the axes interior. It remains suitable for embedding on a white page.
minimal uses airy spacing, 14 px outside labels, 9 px outlined points and no tick marks,
baselines, arrows, grids, full border or mask. ink uses outlined points, inside ticks and
charcoal, ink red, blue, green, violet and ochre. The colorblind preset is available for a dedicated categorical palette.
Continuous colors
Every preset supplies both a categorical palette and a continuous colormap. HMPlot and
Minimal use Viridis; Paper, Journal and Colorblind use Cividis. Ink and Blueprint use custom
sequential maps, and other themes choose a matching built-in map. The colormap applies to
numeric fill/color channels and their legends unless a mark or scale overrides it.
const theme = createTheme({ extends: "hmplot", palette: ["#3478c7", "#df5263"], colormap: "Plasma" });theme = hm.create_theme(extends="hmplot", colormap="Plasma")Axis defaults
axes.line, ticks, tickSize, tickDirection, titleFontWeight, gridColor, gridWidth and gridDash set each axis’s default appearance. Omit gridColor to adapt it to the
background. axes.frame adds a rectangular border and axes.mask clips data to its interior.
Journal, Graph and Blueprint use full borders without arrows. Minimal disables masks;
other presets enable them for rectangular Cartesian 2D plots.
axes.threeD: { style: "box", gridPlanes: [] } supplies defaults for axes3d={true}; triad and plane names xy, xz, yz are also supported. Axes and inherited grids stay off
by default outside 2D Cartesian plots; explicit Plot/Frame settings take precedence.
Themes accept axes.arrow (none, start, end, both) and axes.arrowSize in CSS pixels
(Python: arrow_size). Explicit axis settings override them, for example x={{ arrow: "none" }} to remove an x-axis arrow.
Neutral presentation presets
These are existing presets, with structural differences independent of their palettes:
| Preset | Presentation |
|---|---|
paper | centered serif report heading, bottom inline legend, moderate outlined points |
journal | restrained centered heading, full frame and inside ticks, open points, compact side legend |
presentation | 32 px headings, 18 px ticks/legends/controls, 14 px points and 3 px lines |
notebook | 16 px heading, 12 px labels, close offsets and compact top legend |
minimal | generous title spacing, outside labels, no grid or frame, sparse outlined points |
ink | outlined charcoal points, crisp lines, inside ticks and stacked side legend |
bureau | editorial heading, light axis titles, quiet grid and top inline legend |
observable | compact heading, light axis titles, translucent points and bottom inline legend |
The default hmplot preset is unchanged. Presets leave axis domains, encodings, category order,
bins, interaction and dynamic-margin policy to the chart. Theme point sizes apply only where
an explicit size or size encoding is absent. Open points use a transparent fill; an explicit
fill encoding takes precedence.
Presentation recipes and capability boundaries
Start with a full preset and add narrowly scoped partials. A later partial overrides earlier
keys for its named mark kinds; it does not reset other kinds or the palette. A nested Theme
scopes the same merge to a subtree. Explicit mark props and encodings still win. Alignment is
independent of hierarchy: combine title/editorial with title/centered when desired.
The executable Python recipes in src/recipes/27_centered_report.py through 31_compact_colorbar.py appear in the recipe collection. The matching Svelte
patterns below use the same existing props (imports from hmplot, chart templates from hmplot/charts). Here data is the table supplied by the corresponding recipe.
Centered report:
<Theme value={{ extends: ["paper", "title/centered", "legend/inline-bottom", "marks/lines-medium"] }}>
  <Plot {data} title="Quarterly observations" x={{label:"Month"}} y={{label:"Value"}}>
    <Line x="month" y="value" label="Observed" />
    <Points x="month" y="value" size={9} />
  </Plot>
</Theme>
Dense scatter; keep axis preferences on the intended axis:
<Theme value={{ extends: ["notebook", "marks/points-dense", "legend/compact"] }}>
  <Plot {data} x={{tickCount:4,grid:"off"}} y={{tickCount:4,grid:"major"}}>
    <Points x="x" y="y" fill="station" />
  </Plot>
</Theme>
A supplied interval and local reference rule; the rule does not restyle data Lines:
<Theme value={{ extends: ["paper", "marks/lines-fine", "marks/intervals-crisp"] }}>
  <Plot {data}>
    <Area x="x" lower="lo" upper="hi" opacity={0.15} />
    <ErrorBars x="x" lower="lo" upper="hi" />
    <Line x="x" y="y" label="Estimate" />
    <RuleY y={4} color="#64748b" width={1} dash={[5,3]} />
  </Plot>
</Theme>
An annotation card uses explicit box and leader props. Leave space for its offset, and use box={false} for an unboxed halo note; these are not theme mark keys:
<Callout x={1} y={4} text="Observed response" dx={30} dy={-45} color="#172033"
  box={{fill:"#f8fafc",outlineColor:"#64748b",outlineWidth:1,padding:7,radius:5}}
  leader={{color:"#64748b",width:1}} />
Compact colorbar text and horizontal placement; keep exactly the guide the chart needs:
<Theme value={{ extends: ["notebook", "legend/compact", "legend/inline-bottom"] }}>
  <Plot legend={false}>
    <Heatmap bind:this={cells} fill={matrix} fillScale={colors} pixelated />
    <Legend for={cells} channel="fill" label="Correlation" position="bottom" />
  </Plot>
</Theme>
For axis density use x={{tickCount:4}} (Python tick_count), value-axis-only grid use x={{grid:"off"}} and y={{grid:"major"}}, and categorical rotation use x={{tickLabelAngle:30}}, 45 or 90. These do not rotate the y labels. Short date labels use x={{format:"%b %d",tickCount:4}} on datetime data. Shared outer facet labels belong to the
figure’s Facet configuration rather than a global theme.
The development gallery at /test/theme-comparison compares the same observations using a
shared palette by default. It includes sparse/dense points, explicit bubble sizes with a
size guide, intervals and rules, grouped bars, histograms, dates, long legends, a matrix,
callouts and inputs. Switch off the shared palette to inspect the original palettes. The
partial selector never changes data encodings; select sparse-points to inspect open interiors,
since an explicit categorical fill in scatter deliberately overrides a transparent default.
| Family | Shipped support and remaining boundary |
|---|---|
| Titles | alignment, title size/weight, subtitle/caption sizes, block spacing; separate subtitle weight/color is deferred |
| Axes | existing appearance tokens plus quiet/print/offset partials; tick density, date formats and per-axis rotation use axis props |
| Spacing | automatic text measurement and label-offset partials; no fixed-margin or navigation-policy changes in presets |
| Legends | placement, text/swatch sizing, heading weights and automatic mark shapes; entries flow/wrap with available space, but explicit entry-gap and label-wrap controls are deferred |
| Points | dense, outlined, open and large partials; explicit size/color encodings retain their values |
| Lines and intervals | three Line widths and crisp ErrorBars; fill opacity stays separate from data-line opacity |
| Bars | Bar opacity routes through Prism; Prism does not draw outlines, so outlined bars remain deferred; category spacing uses explicit bandFraction, such as 0.72, and never changes histogram bins |
| Rules | RuleX/RuleY already consume color, width and opacity; role-specific dash uses the rule’s explicit dash prop |
| Bands | explicit BandX/BandY fill/opacity/outline or Area interval bounds; no confidence level is inferred from styling |
| Callouts | themed text only; boxes and leaders use existing explicit props, with anchor and offsets preserved |
| Colorbars | placement changes orientation; current ramps are fixed at 180×18 px horizontally or 18×160 vertically, with fixed 10 px tick text; thickness/length, rounded clips, extension caps and stepped-scale semantics are deferred |
| Matrices | categorical axes and supplied per-cell label colors; no static theme token automatically contrasts every colormap |
| Controls | font and accent tokens only; target sizing, disabled/focus-state redesign and row spacing remain separate follow-ups |
| Print/high contrast | neutral text contrast is tested, but palettes alone do not guarantee distinguishable grayscale series or accessibility; dedicated overlays remain proposals |
The gallery’s matrix demonstrates one explicit contrast recipe, not a general automatic-label
API: its declared black-to-white sRGB ramp maps each value to gray=(value+1)/2. Convert
gray to linear luminance (gray/12.92 below 0.04045, otherwise ((gray+0.055)/1.055)^2.4),
then choose black above luminance 0.179 and white otherwise. Supply those colors as an explicit
Text color scale. For a different colormap, sample its actual colors and compare relative
luminance; the threshold on the data value does not transfer. Heatmap SVG output currently
uses an embedded raster (mode="auto"), with vector labels and colorbar.