animate
Animate one channel of a mark per row, in its scale's space; tween() moves a value in its own units, anywhere in an expression.
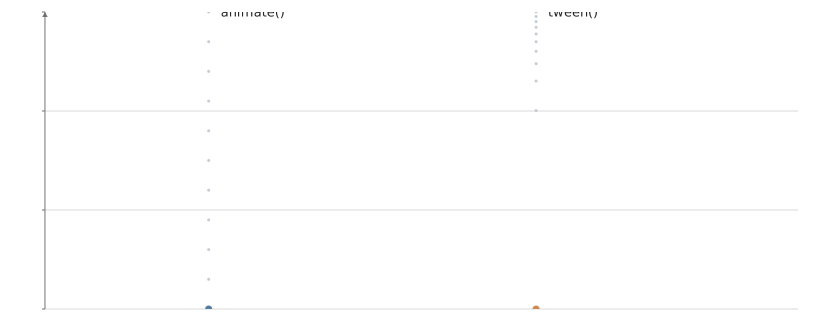
Static preview; loading the interactive plot
import hmplot as hm

# Each press moves a point between 1 and 1000 on a log axis. animate() moves in the axis's scale,
# by equal ratios; tween() moves the value itself, by equal steps, so it passes 100 a tenth of the
# way. The gray dots mark each tenth of the way.
steps = [i / 10 for i in range(11)]
paths = {"x": [1] * 11 + [2] * 11, "y": [1000**t for t in steps] + [1 + 999 * t for t in steps]}
labels = {"x": [1, 2], "y": [1000, 1000], "text": ["animate()", "tween()"]}
up = hm.input.move - hm.floor(hm.input.move / 2) * 2
with hm.Scene() as scene:
    hm.Button(name="move", label="Move")
    with hm.Plot(height=320, axes2d=True, x={"domain": [0.5, 2.8], "visible": False},
                 y={"domain": [1, 1000], "transform": "log"}):
        with hm.Data(paths):
            hm.Points(x="x", y="y", size=3, fill="#c3ccd5")
        with hm.Data(labels):
            hm.Text(x="x", y="y", text="text", dx=12, align="left", size=13)
        with hm.Data({"row": [0]}):
            with hm.Calculate(v=hm.where(up == 1, 1000, 1)):
                hm.Points(x=1, y=hm.animate("v", duration=2000), size=7, fill="#547ba2")
                hm.Points(x=2, y=hm.tween("v", duration=2000), size=7, fill="#cf8955")
scene
Usage
animate(value, {duration, easing, enter, exit}) marks one channel of a mark as animated. It must be the outermost thing on the channel — it is a descriptor, not an expression — and the channel then interpolates per row in its scale space: a point moving from 1 to 100 on a log axis is at 10 halfway, a sqrt axis interpolates in root space, and categorical channels switch at the midpoint. Rows whose value did not change do not move; rows whose value changed continue from their current position and restart the duration. On a keyed update, enter is where a new row starts and exit where a departing row ends before it is removed.
tween(value, {duration, easing}) moves a value itself, in its own units, and can sit anywhere in an expression, including a Calculate column: a Filter, a Bin or mean() under a tweened column sees the values move, and exp(tween("a")) interpolates a. Its producer publishes current values; consumers read an ordinary column. A tween over a moving value (tween(view.time)) trails it by about its duration. Either operator turns off the mark’s implicit transition for that channel, and both run whether or not animation is on. animate(tween(...)) composes; animate() inside an expression, as a Calculate output, or around a @time expression is an error.
animate() or tween()
They differ in where they interpolate. animate() works in scale space, what the scale draws: from 1 to 1000 on a log axis it passes 10 a third of the way and 100 two thirds of the way, evenly up the screen, and a channel mapped through a log color scale changes color as evenly. tween() works in data space: halfway from 1 to 1000 it is 500.5, so on a log axis it shoots up the first decades and creeps through the last. The example below moves one point of each; the gray dots mark each tenth of the way. Use animate() when only the picture should move (and for enter and exit values); use tween() when the moving value is data that a Filter, a Bin, a reduction, a Calculate column or another mark reads. On a linear scale the two move alike.
animation on a mark (or its Plot) is animate() on every channel: the implicit transition interpolates each changed row in scale space, timed by animationDuration and animationEasing (raster marks blend their values instead). animate()’s enter and exit are values; the mark’s enterEffect="fade" and exitEffect="fade" are effects on the row’s opacity, and the two combine.
@time is the view clock in milliseconds. A channel that reads it is re-evaluated every frame and never blocks whenSettled(); a Filter condition, a Calculate column or a transform parameter that reads it re-runs when a value it reads changes. interval(expr, ms) steps what expr reads every ms milliseconds, and floor(x) and round(x) round. keyframes({ms: value, ...}) (Python hm.keyframes) moves through its stops as the clock runs: each value at its time, eased between them (easing “linear”, “ease-in”, “ease-out”, “ease-in-out” or “step”), held before the first and after the last, or repeating with loop; a list of numbers gives a list (a position). It is built from the operations above, so it works wherever an expression does. time takes any expression in place of the clock, so each row can start later: opacity=hm.keyframes({0: 0, 400: 1}, time=hm.view.time - hm.row() * 20) reveals rows one after another, and a Filter whose threshold is a keyframes value draws a line on. It has no transition, so the data part of the channel moves at once when the data changes; the example below keeps its orbiting satellites on a Data of their own so the clock is their only motion. plot.setAnimationTime(ms) freezes the clock (null resumes it) so an export captures one moment; Python export_mp4(path, duration=, fps=) steps it through a video, stitching PNG frames with ffmpeg.
See docs/ANIMATION.md for the lifecycle rules.
animationGroup (animation_group in Python) on Data, Plot or Frame matches animated
rows by a column or list of columns independently of Data keys. It inherits through the
tree; a child Frame overrides its branch, and explicit null (Python None) restores
Data-key/position matching. Filter to one row per group before tweening: a country/year
table can keep key=["country", "year"] and animate by "country" after filtering
to one year. Groups must be unique in each tweened snapshot, and changing the group
column scheme resets motion history. Selection, hover and connections keep Data identity.