tween and @time in the pipeline
A tweened column moves as data: the histogram under it re-bins its rows every frame while they glide to new values, and a Filter on @time lets points in as the view clock passes them.
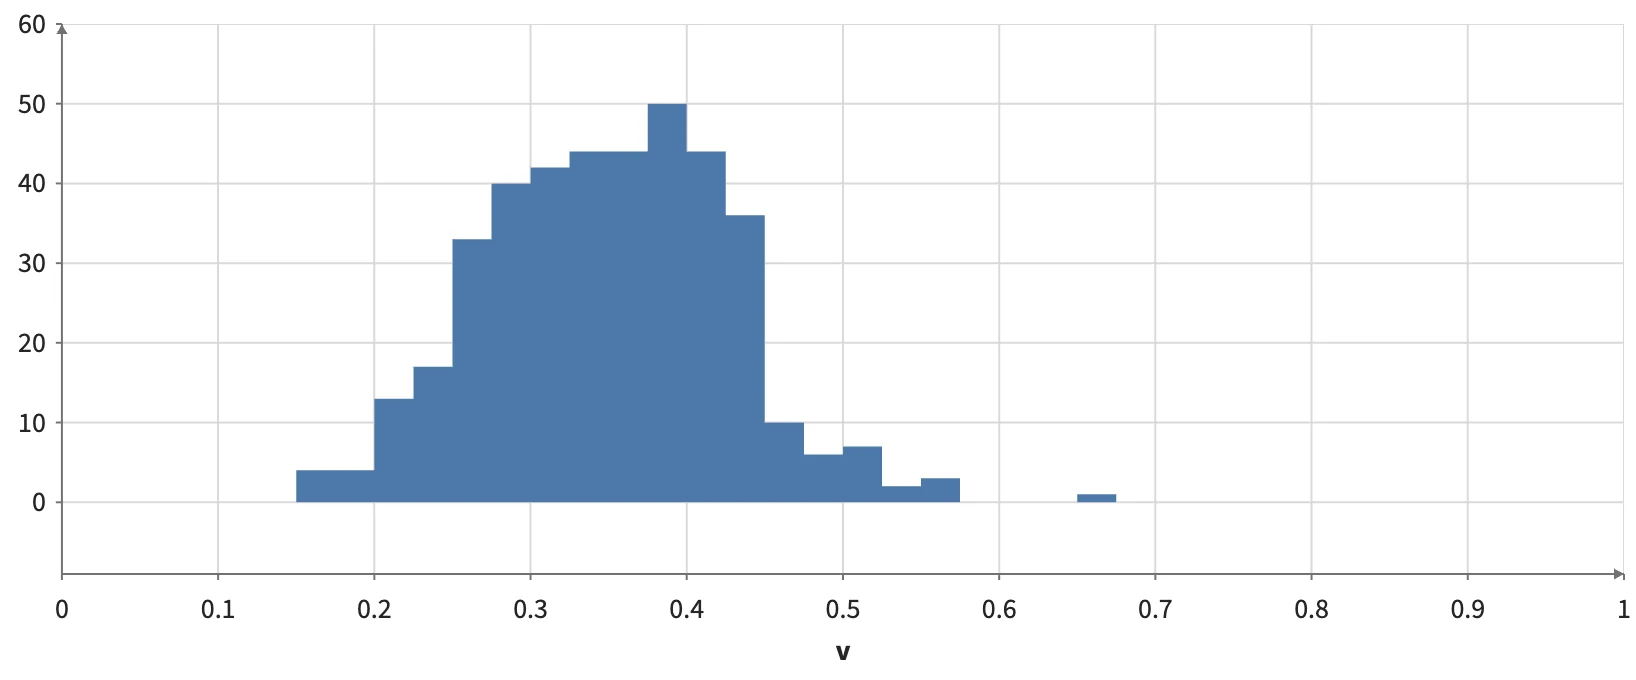
Static preview; loading the interactive plot
<script>
  import { Plot, Calculate, Filter, Rect, Points, tween, less, divide, col } from "hmplot";
import { Bin } from "hmplot/stats";
  const edges = Array.from({ length: 41 }, (_, i) => i / 40);
</script>
<Plot bind:this={plot} data={rows} height={340} axes2d x={{ domain: [0, 1] }} y={{ domain: [-9, 60] }}>
  <!-- v moves: the Bin under it re-bins every frame of the glide -->
  <Calculate columns={{ v: tween("value", { duration: 1200 }) }}>
    <Bin x="v" bins={edges}><Rect x0="x0" x1="x1" y0={0} y1="count" /></Bin>
    <!-- 100 points per second of the view clock -->
    <Filter where={less("order", divide(col("@time"), 10))}>
      <Points x="v" y="lane" size={1.5} />
    </Filter>
  </Calculate>
</Plot>