Density
A kernel density estimate of one column (a smooth histogram), or of two on a grid (a density heatmap).
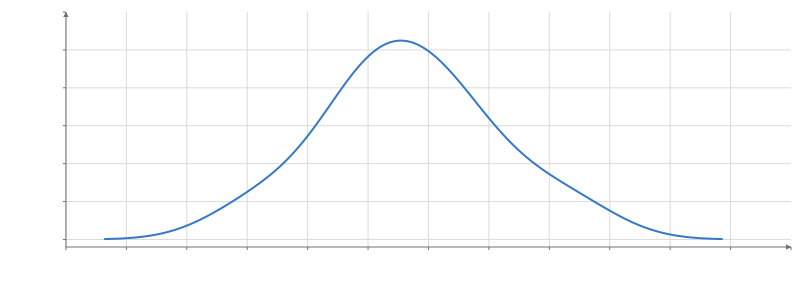
Static preview; loading the interactive plot
import hmplot as hm

data = {"value": [1.2, 2.5, 2.9, 3.1, 3.4, 3.8, 4.2, 4.4, 5.1, 6.3]}
with hm.Plot(data=data, height=300, axes2d=True) as plot:
    with hm.Density(x="value"):
        hm.Line(x="x", y="density")
plot
Usage
Outputs x, optional y, and density. 2D output is a grid table (y then x, cell centres that tile the bounds) that Heatmap draws; grouped by one key it gains a leading dimension of the groups. Default resolution is 256 in 1D or 128×128 in 2D; automatic bandwidth uses Scott scaling. by partitions groups; weight accepts nonnegative weights. normalization chooses density or count.
bandwidth="auto" is Scott’s rule. A number sets it directly, and so does an expression evaluated against this transform’s input, such as multiply(std(col.x), 0.3); resolution accepts one too.
To let the viewer change a setting, read an input in it: bandwidth={input("bandwidth")} (Python bandwidth=hm.input.bandwidth), where bandwidth is a Slider.