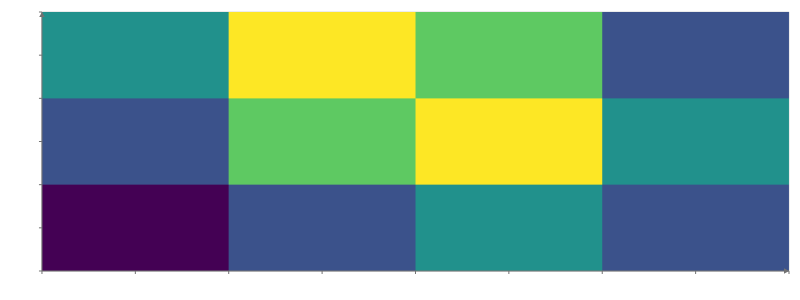
A table for this mark alone: a mark with data displays on its own, in a Plot of its own.
pixelatedboolean
Draw each cell as a flat square of its value instead of blending it into its neighbors. Default: true for a 2-D array of at most 64 cells along each side, without surfaceMode or contours in a 2D plot; false for a grid table.
Position
xcolumn
Over a grid table, the dimension drawn along x. Default: the grid's last dimension.
ycolumn
Over a grid table, the dimension drawn along y. Default: the grid's second-to-last dimension.
zchannel
The z position, in a 3D plot: a column, per-row values, or one value.
Appearance
fillcolumn | number[][]
The values, one per cell, mapped to colors: a 2-D array (nested lists or a NumPy array in Python), or a variable of a grid table. A 2-D array's cell in row i and column j is centered at x = j, y = i (row 0 at the bottom), so the axes span -0.5 to n - 0.5, unless the plot sets the axis's domain.
opacitychannel
The opacity, 0 to 1: a number, or a column (categories map through opacity_scale). Default: 1.
Scales
fill_scalescale
The fill's scale, which marks can share: continuous({domain, colormap, transform}) for numbers, categorical({domain, range}) or ordinal() for categories.
colormapstring | color[] | object
The colormap of a numeric fill or color: a name, a list of colors, or {colors, space, positions}. Default: the theme's (Viridis).
opacity_scalescale
A categorical() scale from the opacity column's categories to opacities, 0 to 1.
Display
labelstring
The mark's name in the legend and the settings pane.
legendboolean
Whether the mark has a legend entry. Default: True.
visibleboolean
Whether the mark is drawn. Default: True.
domainsboolean
Whether the mark's data counts toward its axes' automatic domains; false leaves them to the other marks (a reference line, a decorative part). Default: True.
rows"auto"
"auto" draws one item when no channel reads a column (a line at a value, a label at a point), instead of one per row of the data; "@" view-state fields are not columns.
How the mark mixes with what is drawn under it; any mode but normal draws it transparent, and SVG and PDF exports draw additive and subtractive as an image. Default: "normal".
glownumber
How much the mark glows: its own color times glow blooms around it in the plot's presentation (0 does not glow); the Plot's bloom effect sets the bloom's strength and radius. SVG and PDF exports draw the whole plot as an image. Default: 0.
shadeShadeSpec
A plugin's shade (registerPlugin): { kind, ...parameters }, as { kind: "hatch", spacing: 6 } (Python hm.shade("hatch", spacing=6)), recolors each fragment the mark draws; picking, tooltips, domains and legends are unchanged. SVG and PDF exports draw a shaded mark as an image.
optionsstring[]
The settings the settings pane shows for this mark, by name.
namestring
The mark's name in the settings pane, and the name facet.endpoint() and partition.endpoint() find it by.
Interaction
identityidentity
Whose rows these are for selections: an identity() shared by tables that show the same things. Default: its data's.
selectboolean | selection | object
Click to replace the selection; an exact repeat clears it. Shift/Meta/Ctrl-click toggles membership (whole series for Line, Area): true uses its data's selection, or give a selection(). input("root").set("id") writes an input instead: a click sets it to the clicked row's id (a drill-down's root), .set(literal(v)) to a constant, .reset() to its default, and a click on nothing restores its default (input("root", {default}), else a Select of that name's, else null); several marks may write one input.
hoverboolean | selection | object
Mark the row under the pointer as @hovered (a whole series for Line, Area), without fading the others: true uses its data's hover, or give a selection(). input("focus").set("series") writes an input instead: while the pointer is on a row the input shows its series (or .set(literal(v)), a constant), then its committed value again (a hover that would change this mark's own rows is an error).
tooltipboolean | field[] | object
Show the nearest row's values in a box by the pointer: true, a list of fields, or {fields, radius, content}. Default: the Plot's.
Which interaction states fade this mark's other rows to selection_opacity; "hovered" fades them while hovering, "nearest" while a row is nearest. Default: the states it sets, except hover and nearest.
selection_opacitynumber
The opacity of the rows outside the selection while one is active. Default: 0.25.
enter_effectboolean | "fade" | object
How rows that arrive in a keyed update appear: "fade", or {effect, duration, easing}. animate()'s enter option is the value a channel starts from.
exit_effectboolean | "fade" | object
How rows that leave in a keyed update disappear, as enter_effect. animate()'s exit option is the value a channel ends at.
Animation
animationboolean
Animate changes to the mark's values. Default: False.
animation_durationnumber
How long an animated change takes. Default: 300 ms.
This mark's own z transform, instead of its frame's. Default: its frame's.
z_invertbooleansetting
Reverse this mark's z direction. Default: False.
zbounds[number, number]setting
The z extent this mark maps, instead of its frame's domain (an image's or a grid's extent). Default: its frame's.
zrange[number, number]setting
Where this mark's z extent lands, in its frame's world units. Default: its frame's.
Geometry
detailnumbersetting
How finely a point's or a surface's geometry is divided (sphere segments, grid cells).
Shading
litbooleansetting
Shade the mark with the plot's lights. Default: False.
transparentbooleansetting
Draw the mark in the transparent pass, blended in depth order with other transparent marks. Default: False.
3D settings
size_attenuationbooleansetting
Shrink far points in perspective, as three.js does. Default: True.
Surface settings
z_scalenumbersetting
How high a surface's values stand: the relief's height scale. Default: 0.
surface_modebooleansetting
Draw the grid as a surface whose height is its values, instead of a flat raster. Default: False.
surface3dbooleansetting
Draw the surface in 3D, lit and seen from the camera, rather than flat in 2D. Default: False.
depthtestbooleansetting
Hide the parts of the surface behind other geometry. Default: True.
Advanced renderer options
texture_resolution[number, number]
The size of the texture a Heatmap's child marks are drawn into. In px.
Usage
fill accepts a shaped tensor or a named shaped column. surfaceMode and zScale control numeric relief; texture resolution is independent of mesh detail. Child marks paint an interactive texture.
A plain 2-D array places its cells on their indices: the cell in row i and column j is centered at x = j and y = i, row 0 at the bottom, so a 4 x 4 matrix’s axes span -0.5 to 3.5 with no padding, and its cells stay there beside other marks. The axis’s domain, set on the Plot or Frame, or xbounds/ybounds place the grid over another extent instead, and a Plot that fits no domains (autoBounds={false}, a JavaScript Plot without data) keeps its default one.
For a labeled matrix, pass categorical position scales on the Plot: x={"scale": hm.categorical(domain=column_labels)} and y={"scale": hm.categorical(domain=row_labels)} in Python. The labels name the matrix indices in that order; categorical y puts row 0 at the top, and invert=True reverses it. Axis labels reserve their own margins, unlike manually positioned Text marks near the canvas edge.
For ordered or clustered genes, see the ordered gene heatmap recipe. Supply a leaf order or compute one with SciPy before plotting; index both the matrix rows and gene labels with the same order, leaving the original matrix unchanged. The recipe includes a diverging colorbar, a column condition strip and its legend, with room for 40 gene labels.
pixelated draws each cell as a flat square of its value. Unset, a 2-D array of at most 64 cells along each side draws sharp cells, and a finer one (a sampled field) and a grid table’s field blend neighboring cells smoothly; surfaceMode, contours and a 3D plot’s relief, which read the field between cell centres, blend unless pixelated is set. pixelated={false} blends a small grid; pixelated sharpens a large one.
Over a grid table (a gridTable(), a Grid’s or a 2-D Density’s output; see Data, “Grid tables”), fill names a variable and the Heatmap draws the grid’s last two dimensions, or the ones x and y name, placed by their coordinates: uneven, descending and wrapped coordinates in every mode, a curvilinear grid on its own cells. Missing values and cells a Filter hides draw nothing. Slice away any other dimension first.